このページは、まだ日本語ではご利用いただけません。翻訳中です。
Analyze API Usage and Performance
Custom reporting in Kong Konnect enables you to save, revisit, and share views created during data exploration, facilitating analysis over different time intervals. These reports can be used to analyze metrics, investigate anomalies, and you can share a saved report to communicate these insights with others. Let’s go through some example situations where you could leverage custom reports.
In this scenario, you just joined an organization as an API product manager. Your first task is to create a few reports that model business KPIs so that the executive team and investors have a grasp on the state of the organization’s APIs. You’ve selected the following KPIs because they would give a brief, but holistic, understanding of the APIs:
- Number of requests: This metric measures the total number of requests made to the API. This is good for understanding total usage of an API, and can potentially be used to uncover scalability requirements.
- Throughput: Throughput is the measurement of the number of requests an API can handle per minute. This metric can help you compare HTTP or database servers.
- Latency: This metric measures the time it takes for the API to respond to a request. This can be a good measure of the user experience when a user makes a request to an API.
Build reports
Let’s build some custom reports by navigating to Analytics in the Konnect menu, then Reports.
This brings you to a list of all custom reports in the organization. From here, click New Report to get started.
Total number of requests across APIs over the last 30 days
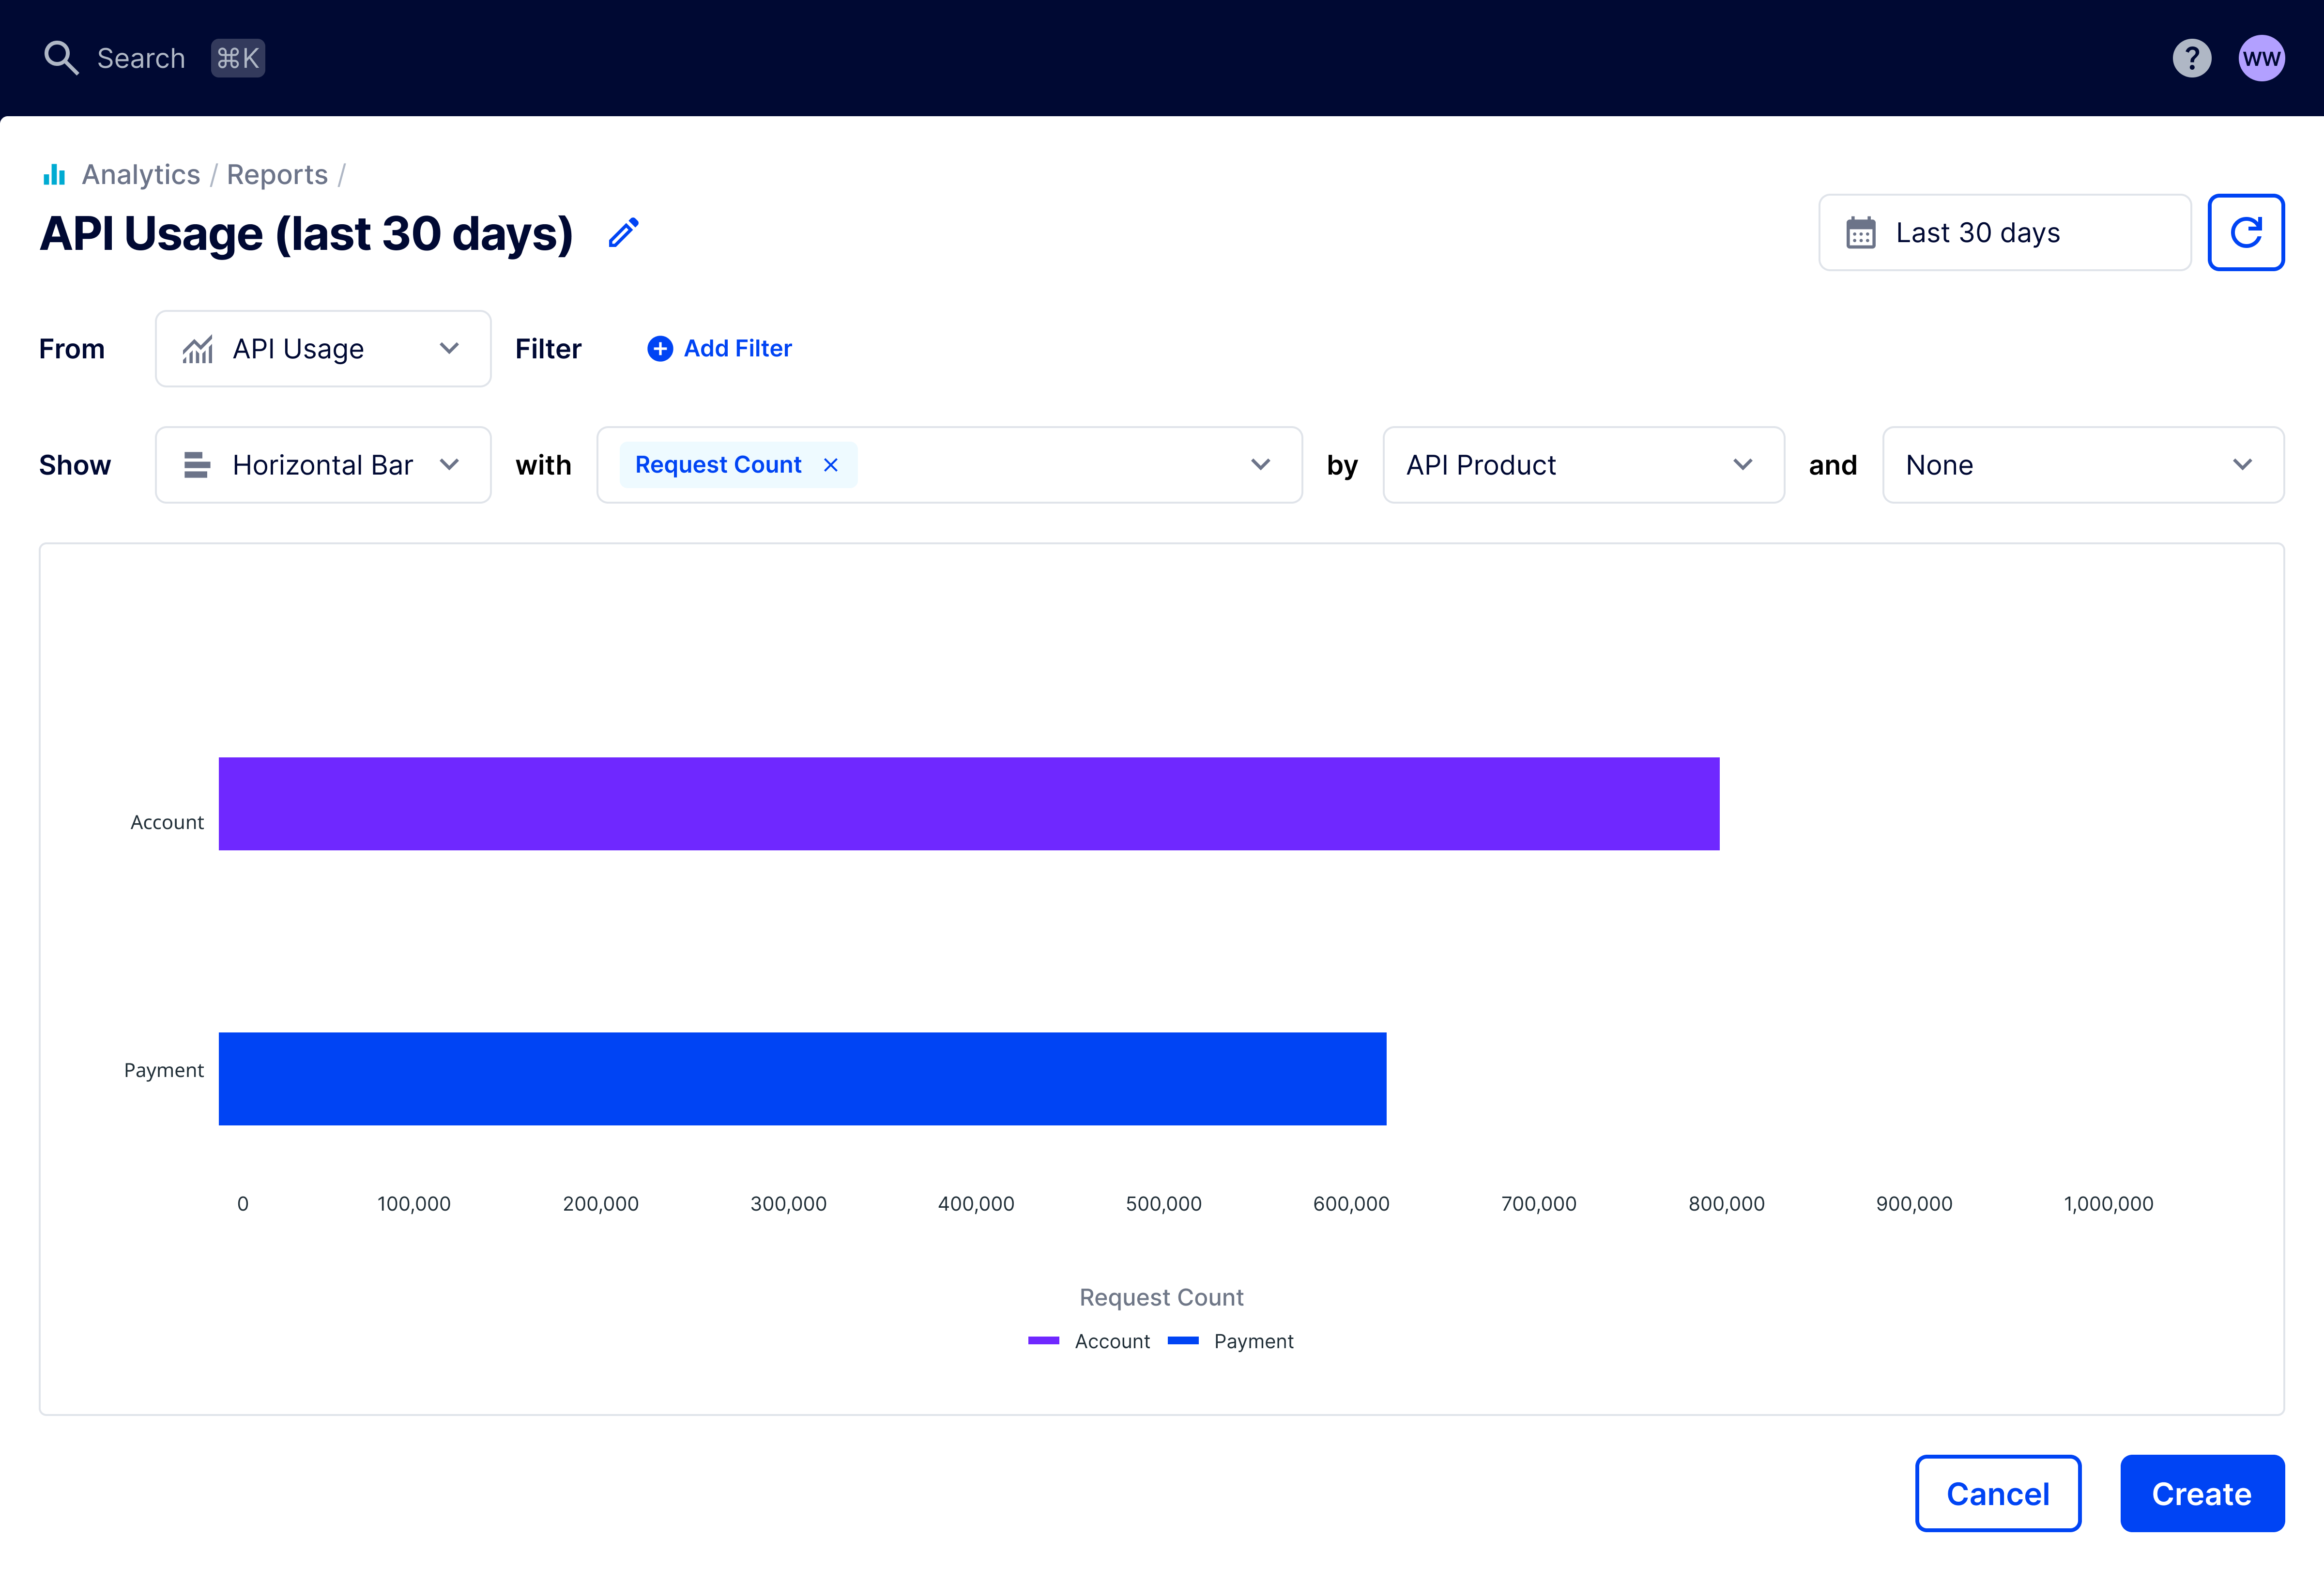
To build a report that displays the total number of requests across all of your APIs over the last 30 days, set the following options in the UI:
- Name: API usage (last 30 days)
- Date/Time: Last 30 days
- From: API usage
- Show: Horizontal Bar
- With: Request Count
- By: API Product
- And: None

Figure 1: Horizontal bar chart showing the total number of requests across all APIs in the organization over the last 30 days.
This report can provide your stakeholders with the answers to questions like:
- How many requests were made to the API during the current month?
- How does this month compare to the previous months?
- Which API product receives the most requests?
The data can be used to support other types of exploratory questions about your API:
- What is the most popular API product?
- Are there spikes in requests across months?
- Are there any errors or issues that might be impacting the number of requests our API is receiving?
Daily API usage for an API over the last 30 days
From the previous report, you determine that the Accounts API is receiving the most traffic. You don’t know whether this is a cause for concern or not, so you decide to take a closer look.
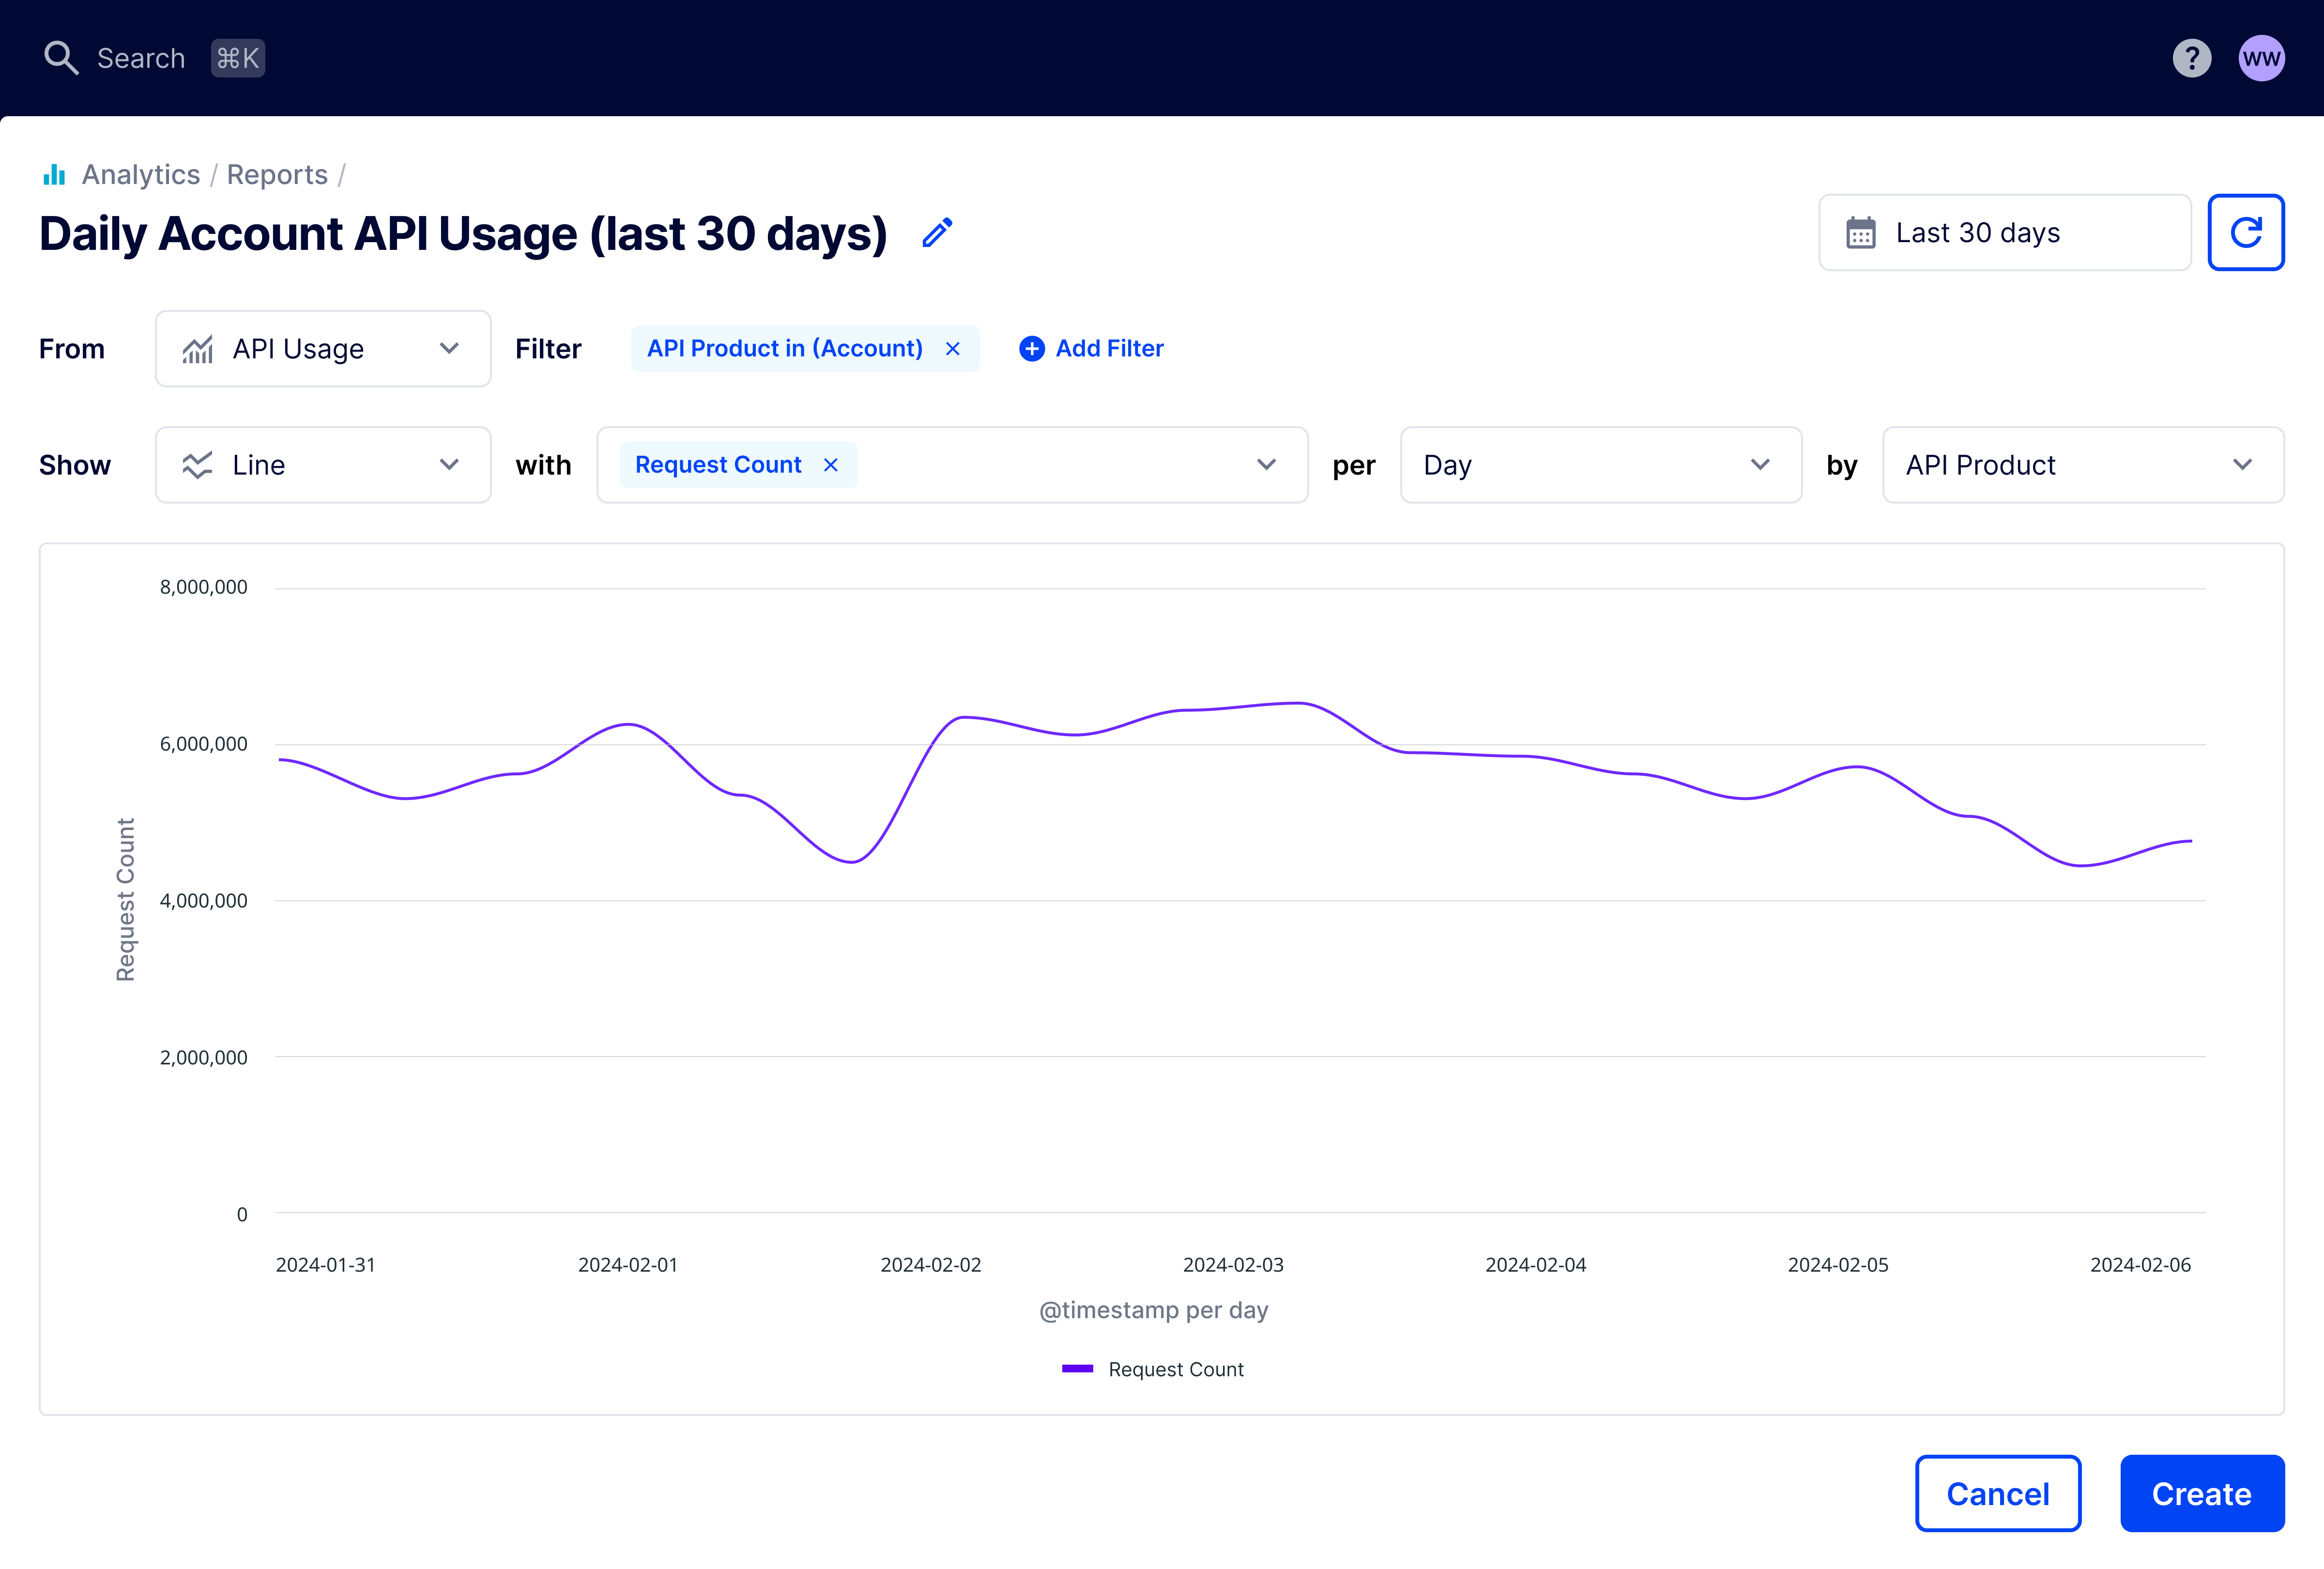
To gain further insight into the Accounts API, let’s build a report that displays the number of requests per day for the Accounts API over the last 30 days. Keep in mind that Kong Konnect only shows daily granularity for custom queries or for queries over one week. Set the following options in the UI:
- Name: Daily Accounts API Usage (last 30 days)
- Date/Time: Last 30 days
- From: API usage
- Show: Line
- With: Request Count
- Per: 1 Day
- By: API Product
Add a filter for the Accounts API. Click Add Filter, then set the following options:
- Filter By: API Product
- Choose Operator: In
- Filter Value: Account (or your own API name)

Figure 2: Line chart showing the daily usage for the Accounts API over the last 30 days.
These reports can provide your stakeholders with the answers to questions like:
- What does average traffic over time look like for this API product?
- Are there any anomalies, such as spikes or drops in traffic?
- If there are anomalies, do they repeat? Are there any patterns in the data?
- If there’s an issue with API traffic, has it been resolved or is it ongoing?
Comparing daily vs per minute traffic
Where a daily report can help stakeholders understand overall demand for the Accounts API, the per minute report provides a more detailed picture. By combining the two reports, you can provide a lot of insight into the usage and performance of your API.
For example, if the Accounts API is seeing a high number of requests per day and per minute, the organization may need to explore upgrading the API to handle the load. Or, you may need to explore the current monetization policy to take advantage of the traffic.
If the Accounts API is seeing a low amount traffic per day, but the per minute report shows normal traffic, you could be dealing with a variety of situations:
- Activity: The API is being used heavily during a specific part of the day.
- Security: Bots, or scripts, could be attempting to misuse your API.
- Stability: If the API is experiencing technical issues, such as slow response times or errors, it could result in a large number of retries that spike the requests per minute.
Total API usage by Kong Konnect application over the last 30 days
You can track requests per minute, per day, and even differentiate it across different APIs. However, because Kong Konnect allows applications to consume API products, you must be able to explain which applications drive the most traffic to your APIs. Applications can be anything: public web applications, mobile applications, and internal Gateway services that consume APIs.
To configure the Kong Konnect to create a look back report of total traffic across different applications, set the following options in the UI:
- Name: API Usage by Application (last 30 days)
- Date/Time: Last 30 days
- From: API usage
- Show: Vertical Bar
- With: Request Count
- By: API Product
- And: Application

Figure 4: Vertical bar chart showing total API usage by Kong Konnect application over the last 30 days.
This report can be used to highlight which applications users prefer and where to distribute resources. Combined with the other reports, you can now communicate application-level usage data to your stakeholders. This data can help answer questions about how your APIs are being consumed.
Some example scenarios where this type of report would be useful are:
- Security: If you find that a particular application is generating more traffic than expected, you can assess its security to ensure that it won’t be a potential risk for the organization.
- Monetization: If you have a monetization strategy, knowing which applications are actually consuming the data can help you allocate resources to make financial decisions.
- Innovation: You can identify API usage patterns and trends using these reports, which can help you allocate resources and make development decisions.
Latency for an API over the last 30 days
At this point, you have multiple reports that display how your company’s APIs are performing generally.
Your company determines that it is critical that payments are processed quickly using the Payments API, so you decide to generate a report that will tell you how performant the Payment API is over the last 30 days. To build the report, set the following options in the UI:
- Name: Payment API - Latency (last 30 days)
- Date/Time: Last 30 days
- From: API usage
- Show: Line
- With: Response Latency (p99)
- Per: 1 Day
- By: API Product
Add a filter for the Payment API. Click Add Filter, then set the following options:
- Filter By: API Product
- Choose Operator: In
- Filter Value: Payment

Figure 5: Line chart showing the latency for the Payments API over the last 30 days.
This report can provide your stakeholders with the answers to questions like:
- How performant has my API been over the last 30 days?
- Is my Payment API processing payments quickly enough?
- Are there any performance outliers?
Share reports
Now that you have your reports ready, you might want to share them with your stakeholders.
You can do this in a few different ways:
- Grant your stakeholders the Analytics Viewer role in the Konnect organization to access reports in a read-only state, or the Analytics Editor role to let them customize the reports for themselves.
- Take screenshots of the reports and share the images.
-
Export any of the reports you created into CSV files. This gives you raw data that you can plug into any of your external dashboards or visualization services.
Open one of the reports you created, then from the Reports Actions drop-down, select Export Report as CSV.
Conclusion
Now that you’ve created these reports and gleaned some insights from the data, you can be more informed when you talk to your stakeholders.
You learned that:
- Custom reports can be used to view metrics like number of requests, latency, and throughput
- You can use information from reports to dig deeper into any anomalies, performance, or stability issues to determine what is causing the problem
- After you create a report, you can export and share the reports with stakeholders to let them draw conclusions based on further analysis
If you want to continue learning about ways to use Konnect to analyze data, read Diagnosing latency issues.


