このページは、まだ日本語ではご利用いただけません。翻訳中です。
Diagnosing Latency Issues
Custom reporting in Kong Konnect gives you the power to monitor your API data in detail and export that data to a CSV file. Let’s go through an example situation where you could leverage custom reports.
Build reports
You can build custom reports by navigating to Analytics in the Konnect menu, then Reports. This brings you to a list of all custom reports in the organization. From here, click New Report to get started.
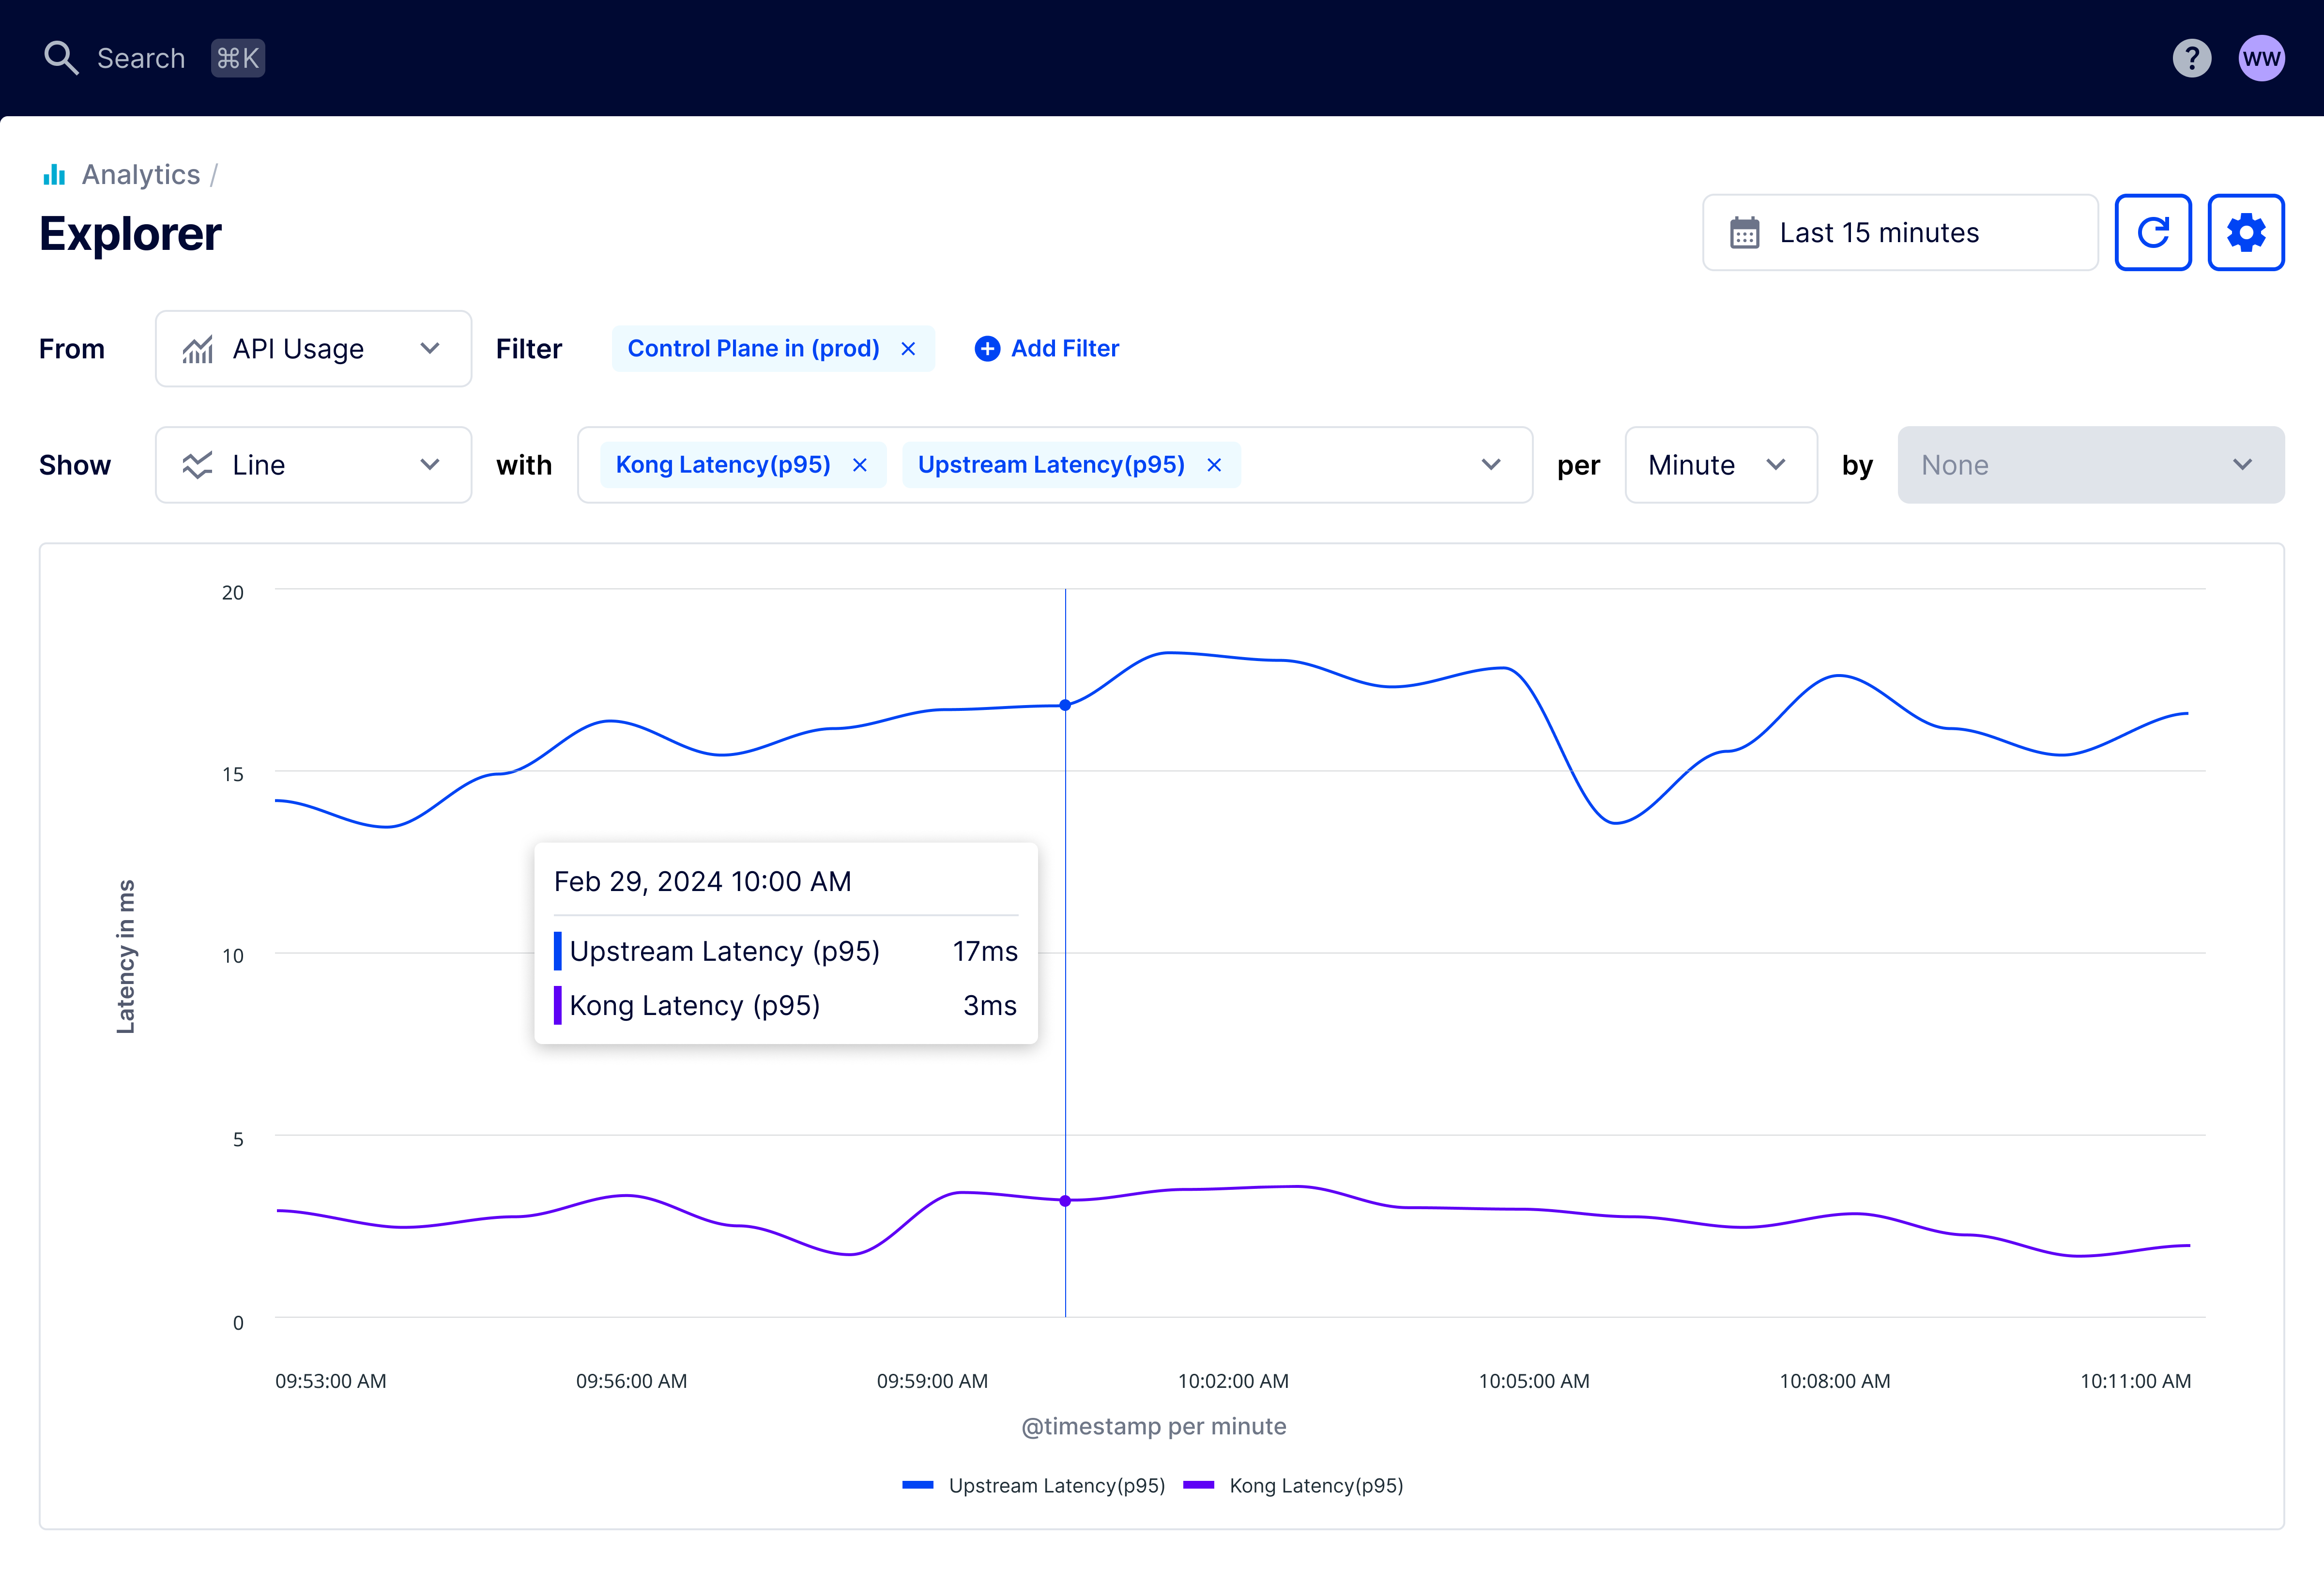
- Name: Production - Kong vs Upstream Latency (last hour)
- Chart type: Line chart
- Date/Time: Last One Hour
- Metrics: Kong Latency (avg), Upstream Latency (avg)
- Choose Granularity: Minutely
You can select more than one metric by clicking on Select Multiple next to the Metrics dropdown list.
Then, you can add a filter for the control plane:
- Filter by: Control Plane
- Operator: In
- Value: prod

Figure 1: Line chart showing average upstream and Kong latency over the last hour.
Conclusion
With this type of report, you can start exploring which upstream service might cause the latency spike.


