コンテンツにスキップ
Kong Logo | Kong Docs Logo
  • ドキュメント
    • API仕様を確認する
      View all API Specs すべてのAPI仕様を表示 View all API Specs arrow image
    • ドキュメンテーション
      API Specs
      Kong Gateway
      軽量、高速、柔軟なクラウドネイティブAPIゲートウェイ
      Kong Konnect
      SaaSのエンドツーエンド接続のための単一プラットフォーム
      Kong AI Gateway
      GenAI インフラストラクチャ向けマルチ LLM AI Gateway
      Kong Mesh
      Kuma と Envoy をベースにしたエンタープライズサービスメッシュ
      decK
      Kongの構成を宣言型で管理する上で役立ちます
      Kong Ingress Controller
      Kubernetesクラスタ内で動作し、Kongをプロキシトラフィックに設定する
      Kong Gateway Operator
      YAMLマニフェストを使用してKubernetes上のKongデプロイメントを管理する
      Insomnia
      コラボレーティブAPI開発プラットフォーム
  • Plugin Hub
    • Plugin Hubを探索する
      View all plugins すべてのプラグインを表示 View all plugins arrow image
    • 機能性 すべて表示 View all arrow image
      すべてのプラグインを表示
      AI's icon
      AI
      マルチ LLM AI Gatewayプラグインを使用してAIトラフィックを管理、保護、制御する
      認証's icon
      認証
      認証レイヤーでサービスを保護する
      セキュリティ's icon
      セキュリティ
      追加のセキュリティレイヤーでサービスを保護する
      トラフィック制御's icon
      トラフィック制御
      インバウンドおよびアウトバウンドAPIトラフィックの管理、スロットル、制限
      サーバーレス's icon
      サーバーレス
      他のプラグインと組み合わせてサーバーレス関数を呼び出します
      分析と監視's icon
      分析と監視
      APIとマイクロサービストラフィックを視覚化、検査、監視
      変革's icon
      変革
      Kongでリクエストとレスポンスをその場で変換
      ログ記録's icon
      ログ記録
      インフラストラクチャに最適なトランスポートを使用して、リクエストと応答データをログに記録します
  • サポート
  • コミュニティ
  • Kongアカデミー
デモを見る 無料トライアルを開始
Kong Mesh
2.2.x
  • Home icon
  • Kong Mesh
  • Explore
  • Observability
report-issue問題を報告する
  • Kong Gateway
  • Kong Konnect
  • Kong Mesh
  • Kong AI Gateway
  • Plugin Hub
  • decK
  • Kong Ingress Controller
  • Kong Gateway Operator
  • Insomnia
  • Kuma

  • ドキュメント投稿ガイドライン
  • 2.10.x (latest)
  • 2.9.x
  • 2.8.x
  • 2.7.x (LTS)
  • 2.6.x
  • 2.5.x
  • 2.4.x
  • 2.3.x
  • 2.2.x
  • Introduction
    • About service meshes
    • Overview of Kong Mesh
    • How Kong Mesh works
    • Architecture
    • Stages of software availability
    • Version support policy
    • Mesh requirements
    • Release notes
  • Getting Started
  • Kong Mesh in Production
    • Overview
    • Deployment topologies
      • Overview
      • Standalone deployment
      • Multi-zone deployment
    • Install kumactl
    • Use Kong Mesh
    • Control plane deployment
      • Kong Mesh license
      • Deploy a standalone control plane
      • Deploy a multi-zone global control plane
      • Zone Ingress
      • Zone Egress
      • Configure zone proxy authentication
      • Control plane configuration reference
      • Systemd
    • Create multiple service meshes in a cluster
    • Data plane configuration
      • Data plane proxy
      • Configure the data plane on Kubernetes
      • Configure the data plane on Universal
      • Configure the Kong Mesh CNI
      • Configure transparent proxying
      • IPv6 support
    • Secure your deployment
      • Manage secrets
      • Authentication with the API server
      • Authentication with the data plane proxy
      • Configure data plane proxy membership
      • Secure access across services
      • Kong Mesh RBAC
      • FIPS support
    • Kong Mesh user interface
    • Upgrades and tuning
      • Upgrade Kong Mesh
      • Performance fine-tuning
  • Deploy
    • Explore Kong Mesh with the Kubernetes demo app
    • Explore Kong Mesh with the Universal demo app
  • Explore
    • Gateway
      • Delegated
      • Builtin
    • CLI
      • kumactl
    • Observability
      • Demo setup
      • Control plane metrics
      • Configuring Prometheus
      • Configuring Grafana
      • Configuring Datadog
      • Observability in multi-zone
    • Inspect API
      • Matched policies
      • Affected data plane proxies
      • Envoy proxy configuration
    • Kubernetes Gateway API
      • Installation
      • Usage
      • TLS termination
      • Customization
      • Multi-mesh
      • Multi-zone
      • How it works
  • Networking
    • Service Discovery
    • DNS
      • How it works
      • Installation
      • Configuration
      • Usage
    • Non-mesh traffic
      • Incoming
      • Outgoing
    • Transparent Proxying
  • Monitor & manage
    • Dataplane Health
      • Circuit Breaker Policy
      • Kubernetes and Universal Service Probes
      • Health Check Policy
    • Control Plane Configuration
      • Modifying the configuration
      • Inspecting the configuration
      • Store
  • Policies
    • Introduction
    • General notes about Kong Mesh policies
    • Applying Policies
    • How Kong Mesh chooses the right policy to apply
    • Understanding TargetRef policies
    • Protocol support in Kong Mesh
    • Mutual TLS
      • Usage of "builtin" CA
      • Usage of "provided" CA
      • Permissive mTLS
      • Certificate Rotation
    • Traffic Permissions
      • Usage
      • Access to External Services
    • Traffic Route
      • Usage
    • Traffic Metrics
      • Expose metrics from data plane proxies
      • Expose metrics from applications
      • Override Prometheus settings per data plane proxy
      • Filter Envoy metrics
      • Secure data plane proxy metrics
    • Traffic Trace
      • Add a tracing backend to the mesh
      • Add TrafficTrace resource
    • Traffic Log
      • Add a logging backend
      • Add a TrafficLog resource
      • Logging external services
      • Builtin Gateway support
      • Access Log Format
    • Locality-aware Load Balancing
      • Enabling locality-aware load balancing
    • Fault Injection
      • Usage
      • Matching
    • Health Check
      • Usage
      • Matching
    • Circuit Breaker
      • Usage
      • Matching
      • Builtin Gateway support
      • Non-mesh traffic
    • External Service
      • Usage
      • Builtin Gateway support
    • Retry
      • Usage
      • Matching
      • Builtin Gateway support
    • Timeout
      • Usage
      • Configuration
      • Default general-purpose Timeout policy
      • Matching
      • Builtin Gateway support
      • Inbound timeouts
      • Non-mesh traffic
    • Rate Limit
      • Usage
      • Matching destinations
      • Builtin Gateway support
    • Virtual Outbound
      • Examples
    • MeshGateway
      • TLS Termination
    • MeshGatewayRoute
      • Listener tags
      • Matching
      • Filters
      • Reference
    • MeshGatewayInstance
    • Service Health Probes
      • Kubernetes
      • Universal probes
    • MeshAccessLog (Beta)
      • TargetRef support matrix
      • Configuration
      • Examples
    • MeshCircuitBreaker (Beta)
      • TargetRef support matrix
      • Configuration
      • Examples
    • MeshFaultInjection (Beta)
      • TargetRef support matrix
      • Configuration
      • Examples
    • MeshHealthCheck (Beta)
      • TargetRef support matrix
      • Configuration
      • Examples
    • MeshHTTPRoute (Beta)
      • TargetRef support matrix
      • Configuration
      • Examples
      • Merging
    • MeshProxyPatch (Beta)
      • TargetRef support matrix
      • Configuration
      • Examples
      • Merging
    • MeshRateLimit (Beta)
      • TargetRef support matrix
      • Configuration
      • Examples
    • MeshRetry (Beta)
      • TargetRef support matrix
      • Configuration
      • Examples
    • MeshTimeout (Beta)
      • TargetRef support matrix
      • Configuration
      • Examples
    • MeshTrace (Beta)
      • TargetRef support matrix
      • Configuration
      • Examples
    • MeshTrafficPermission (Beta)
      • TargetRef support matrix
      • Configuration
      • Examples
    • MeshLoadBalancingStrategy (Beta)
      • TargetRef support matrix
      • Configuration
      • Examples
    • OPA policy
    • MeshOPA (beta)
    • MeshGlobalRateLimit (beta)
  • Enterprise Features
    • Overview
    • HashiCorp Vault CA
    • Amazon ACM Private CA
    • cert-manager Private CA
    • OPA policy support
    • MeshOPA (beta)
    • Multi-zone authentication
    • FIPS support
    • Certificate Authority rotation
    • Role-Based Access Control
    • UBI Images
    • Windows Support
    • ECS Support
    • Auditing
    • MeshGlobalRateLimit (beta)
  • Reference
    • HTTP API
    • Kubernetes annotations and labels
    • Kuma data collection
    • Control plane configuration reference
    • Envoy proxy template
  • Community
    • Contribute to Kuma
enterprise-switcher-icon 次に切り替える: OSS
On this pageOn this page
  • Demo setup
  • Control plane observability
    • Metrics
  • Configuring Prometheus
    • Using an already existing prometheus setup
  • Configuring Grafana
    • Grafana extensions
  • Configuring Datadog
    • Metrics
    • Tracing
    • Logs
  • Observability in multi-zone
    • Prometheus
    • Jaeger, Loki, Datadog and others

このページは、まだ日本語ではご利用いただけません。翻訳中です。

旧バージョンのドキュメントを参照しています。 最新のドキュメントはこちらをご参照ください。

Observability

This page will describe how to configure different observability tools to work with Kong Mesh.

Demo setup

kumactl ships with a builtin observability stack which consists of:

  • prometheus for metrics
  • jaeger for ingesting and storing traces
  • loki for ingesting and storing logs
  • grafana for querying and displaying metrics, traces and logs

First, remember to configure Kong Mesh appropriately for the tools in the observability stack:

  • Traffic metrics for telemetry
  • TrafficTrace for tracing
  • TrafficLog for logging

On Kubernetes, the stack can be installed with:

kumactl install observability | kubectl apply -f -

This will create a namespace mesh-observability with prometheus, jaeger, loki and grafana installed and setup to work with Kong Mesh.

This setup is meant to be used for trying out Kong Mesh. It is in no way fit for use in production. For production setups we recommend referring to each project’s website or to use a hosted solution like Grafana cloud or Datadog.

Control plane observability

The control plane supports metrics and traces for observability.

Metrics

Control plane metrics are exposed on port :5680 and available under the standard path /metrics.

Configuring Prometheus

The Kong Mesh community has contributed a builtin service discovery to Prometheus, it is documented in the Prometheus docs. This service discovery will connect to the control plane and retrieve all data planes with enabled metrics which Prometheus will scrape and retrieve metrics according to your traffic metrics setup.

There are 2 ways you can run prometheus:

  1. Inside the mesh (default for kumactl install observability). In this case you can use mTLS to retrieve the metrics. This provides high security but will require one prometheus per mesh and might not be accessible if your mesh becomes unavailable. It will also require one Prometheus deployment per Kong Mesh mesh.
  2. Outside the mesh. In this case you’ll need to specify skipMTLS: true in the traffic metrics configuration. This is less secure but ensures Prometheus is as available as possible. It’s also easier to add to an existing setup with services in and outside the mesh.

In production, we recommend the second option as it provides better visibility when things go wrong, and it’s usually acceptable for metrics to be less secure.

Using an already existing prometheus setup

In Prometheus version 2.29 and later, you can add Kong Mesh metrics to your prometheus.yml:

scrape_configs:
    - job_name: 'kuma-dataplanes'
      scrape_interval: "5s"
      relabel_configs:
      - source_labels:
        - __meta_kuma_mesh
        regex: "(.*)"
        target_label: mesh
      - source_labels:
        - __meta_kuma_dataplane
        regex: "(.*)"
        target_label: dataplane
      - action: labelmap
        regex: __meta_kuma_label_(.+)
      kuma_sd_configs:
      - server: "http://kong-mesh-control-plane.kong-mesh-system.svc:5676" # replace with the url of your control plane

For more information, see the Prometheus documentation.

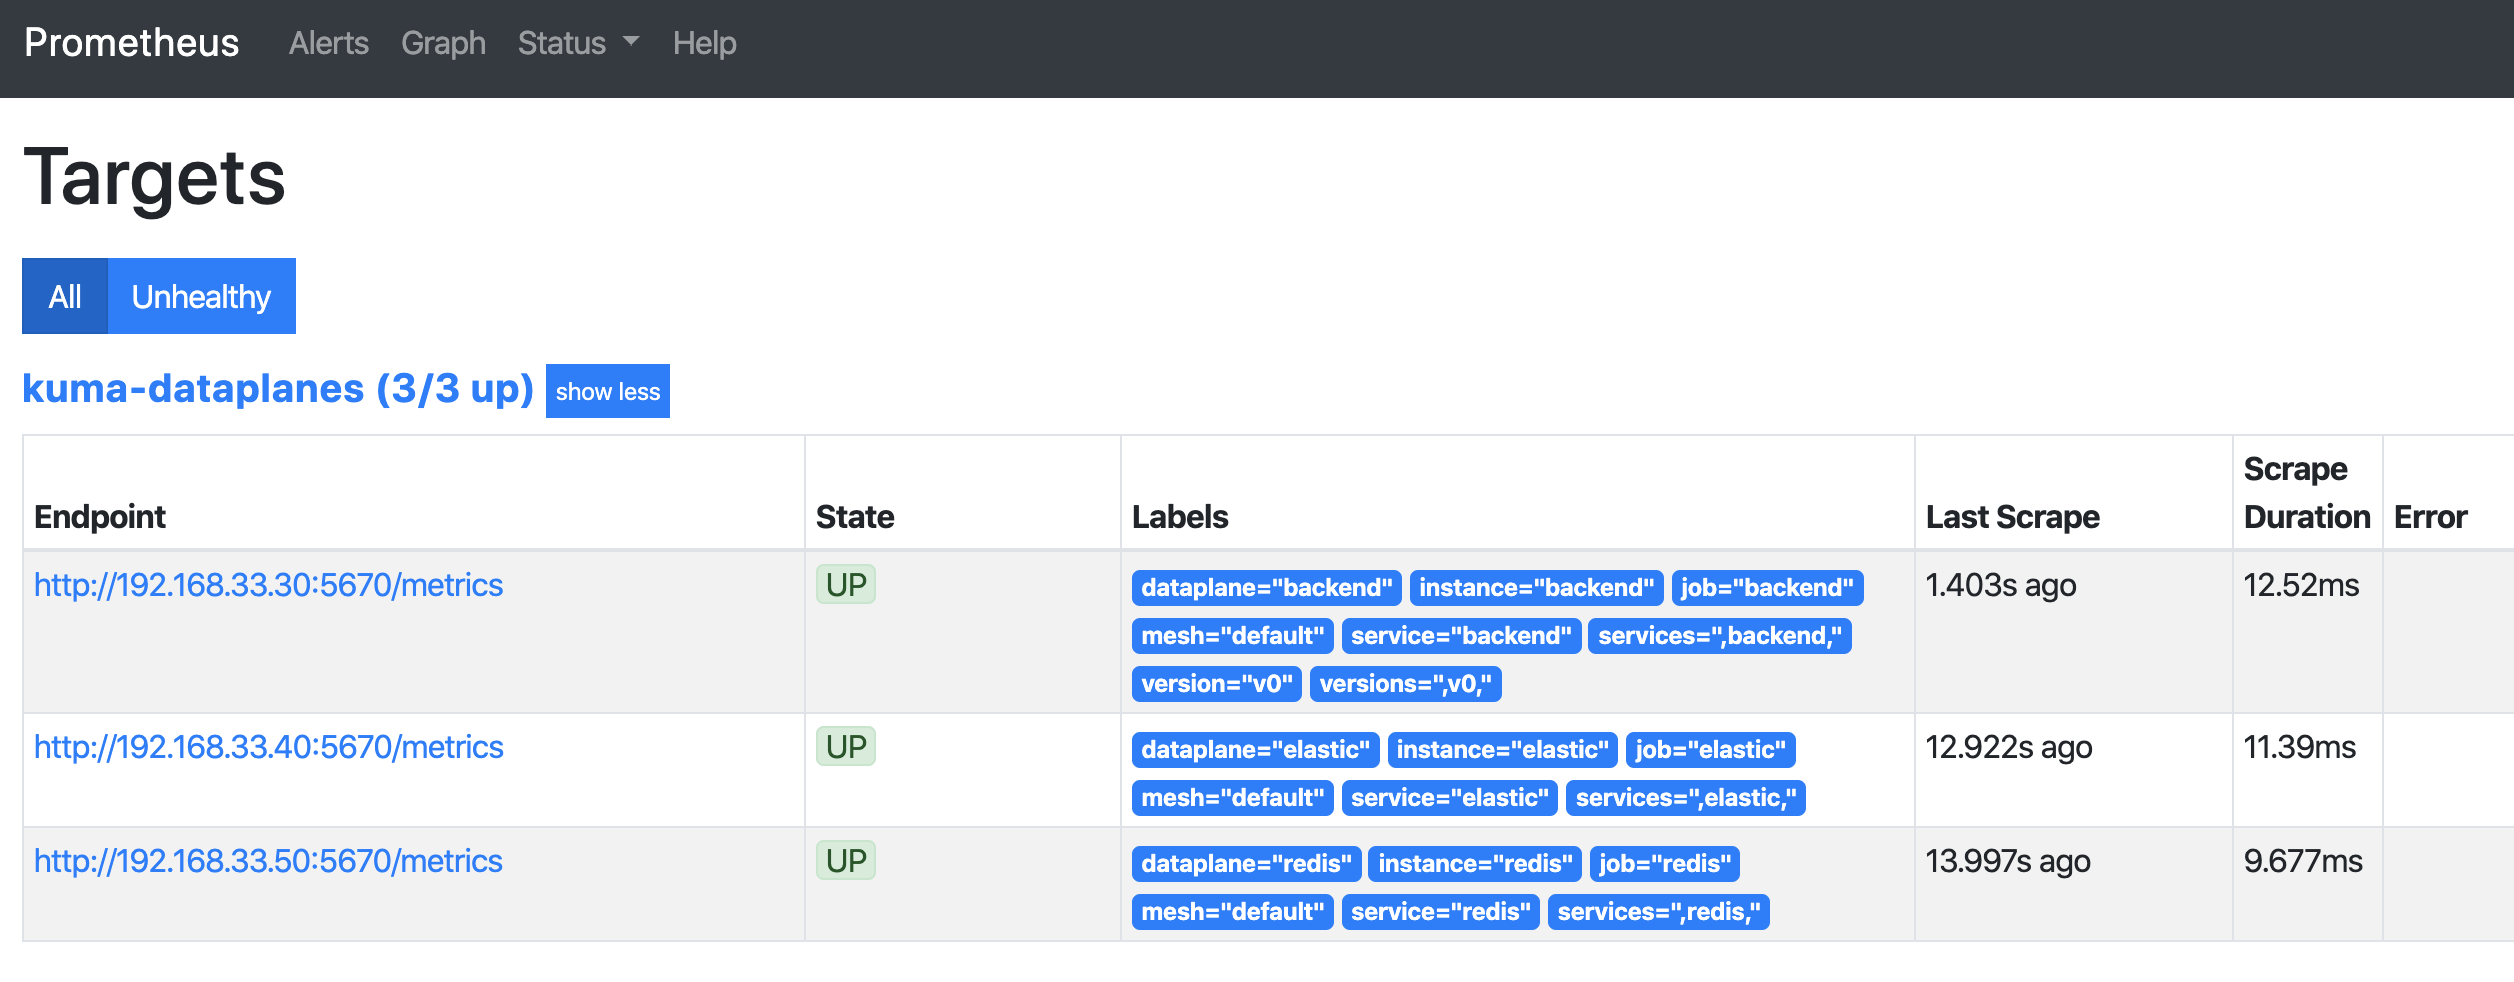
If you have traffic metrics enabled for your mesh, check the Targets page in the Prometheus dashboard. You should see a list of data plane proxies from your mesh. For example:

A screenshot of Targets page on Prometheus UI

Configuring Grafana

Visualizing traces

To visualise your traces you need to have Grafana up and running.

kumactl install observability sets this up out of the box.

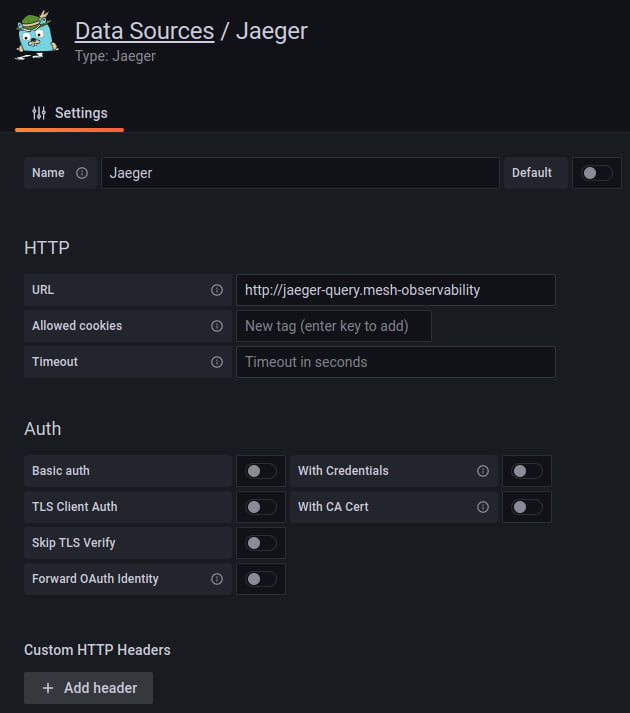
With Grafana installed you can configure a new datasource with url:http://jaeger-query.mesh-observability/ (or whatever url jaeger can be queried at). Grafana will then be able to retrieve the traces from Jaeger.

Jaeger Grafana configuration

You can then add a TrafficTrace policy to your mesh to start emitting traces. At this point you can visualize your traces in Grafana by choosing the jaeger datasource in the explore section.
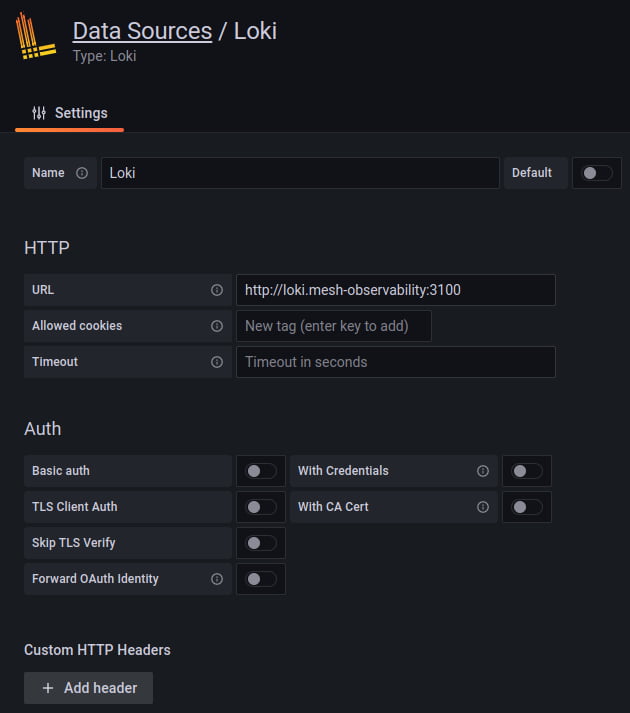
Visualizing logs

To visualise your containers’ logs and your access logs you need to have a Grafana up and running.

kumactl install observability sets this up out of the box.

Loki Grafana configuration

You can then add a TrafficLog policy to your mesh to start emitting access logs. Loki will pick up logs that are sent to stdout. To send logs to stdout you can configure the logging backend as shown below:

Kubernetes
Universal
apiVersion: kuma.io/v1alpha1
kind: Mesh
metadata:
  name: default
spec:
  logging:
    defaultBackend: stdout
    backends:
      - name: stdout
        type: file
        conf:
          path: /dev/stdout
type: Mesh
name: default
logging:
  defaultBackend: stdout
  backends:
    - name: stdout
      type: file
      conf:
        path: /dev/stdout

At this point you can visualize your containers’ logs and your access logs in Grafana by choosing the loki datasource in the explore section.

For example, running: {container="kuma-sidecar"} |= "GET" will show all GET requests on your cluster. To learn more about the search syntax check the Loki docs.

Nice to have

Having your Logs and Traces in the same visualisation tool can come really handy. By adding the traceId in your app logs you can visualize your logs and the related Jaeger traces. To learn more about it go read this article.

Grafana extensions

The Kong Mesh community has built a datasource and a set of dashboards to provide great interactions between Kong Mesh and Grafana.

Datasource and service map

The Grafana Datasource is a datasource specifically built to relate information from the control plane with Prometheus metrics.

Current features include:

  • Display the graph of your services with the MeshGraph using Grafana nodeGraph panel.
  • List meshes.
  • List zones.
  • List services.

To use the plugin you’ll need to add the binary to your Grafana instance by following the installation instructions.

To make things simpler the datasource is installed and configured when using kumactl install observability.

Dashboards

Kong Mesh ships with default dashboards that are available to import from the Grafana Labs repository.
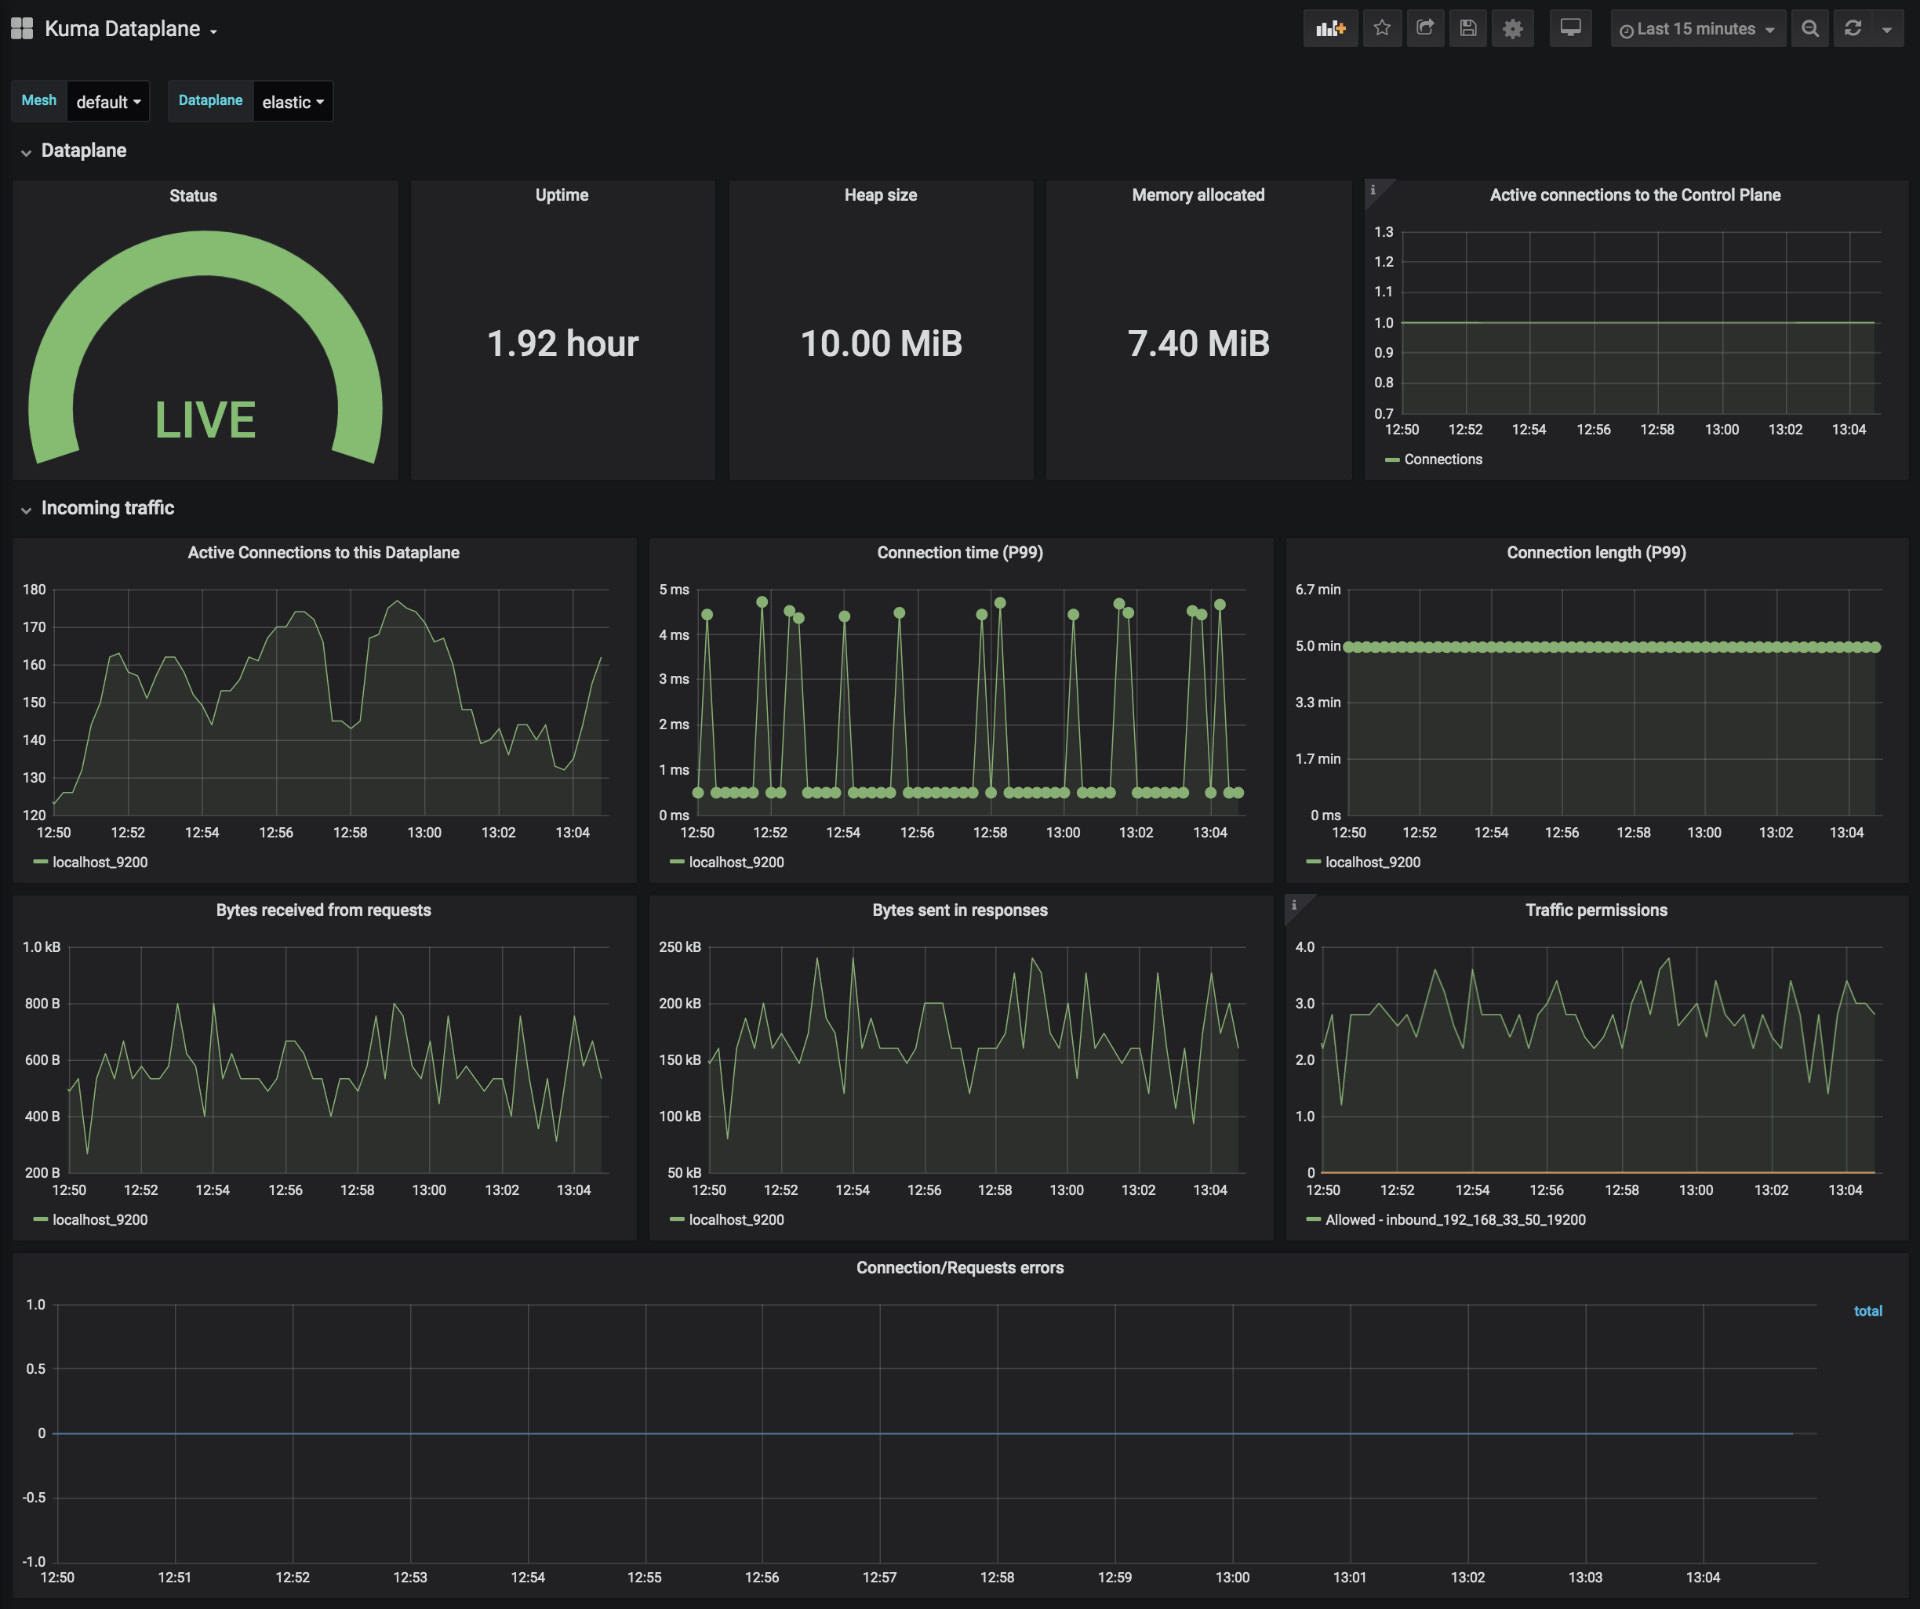
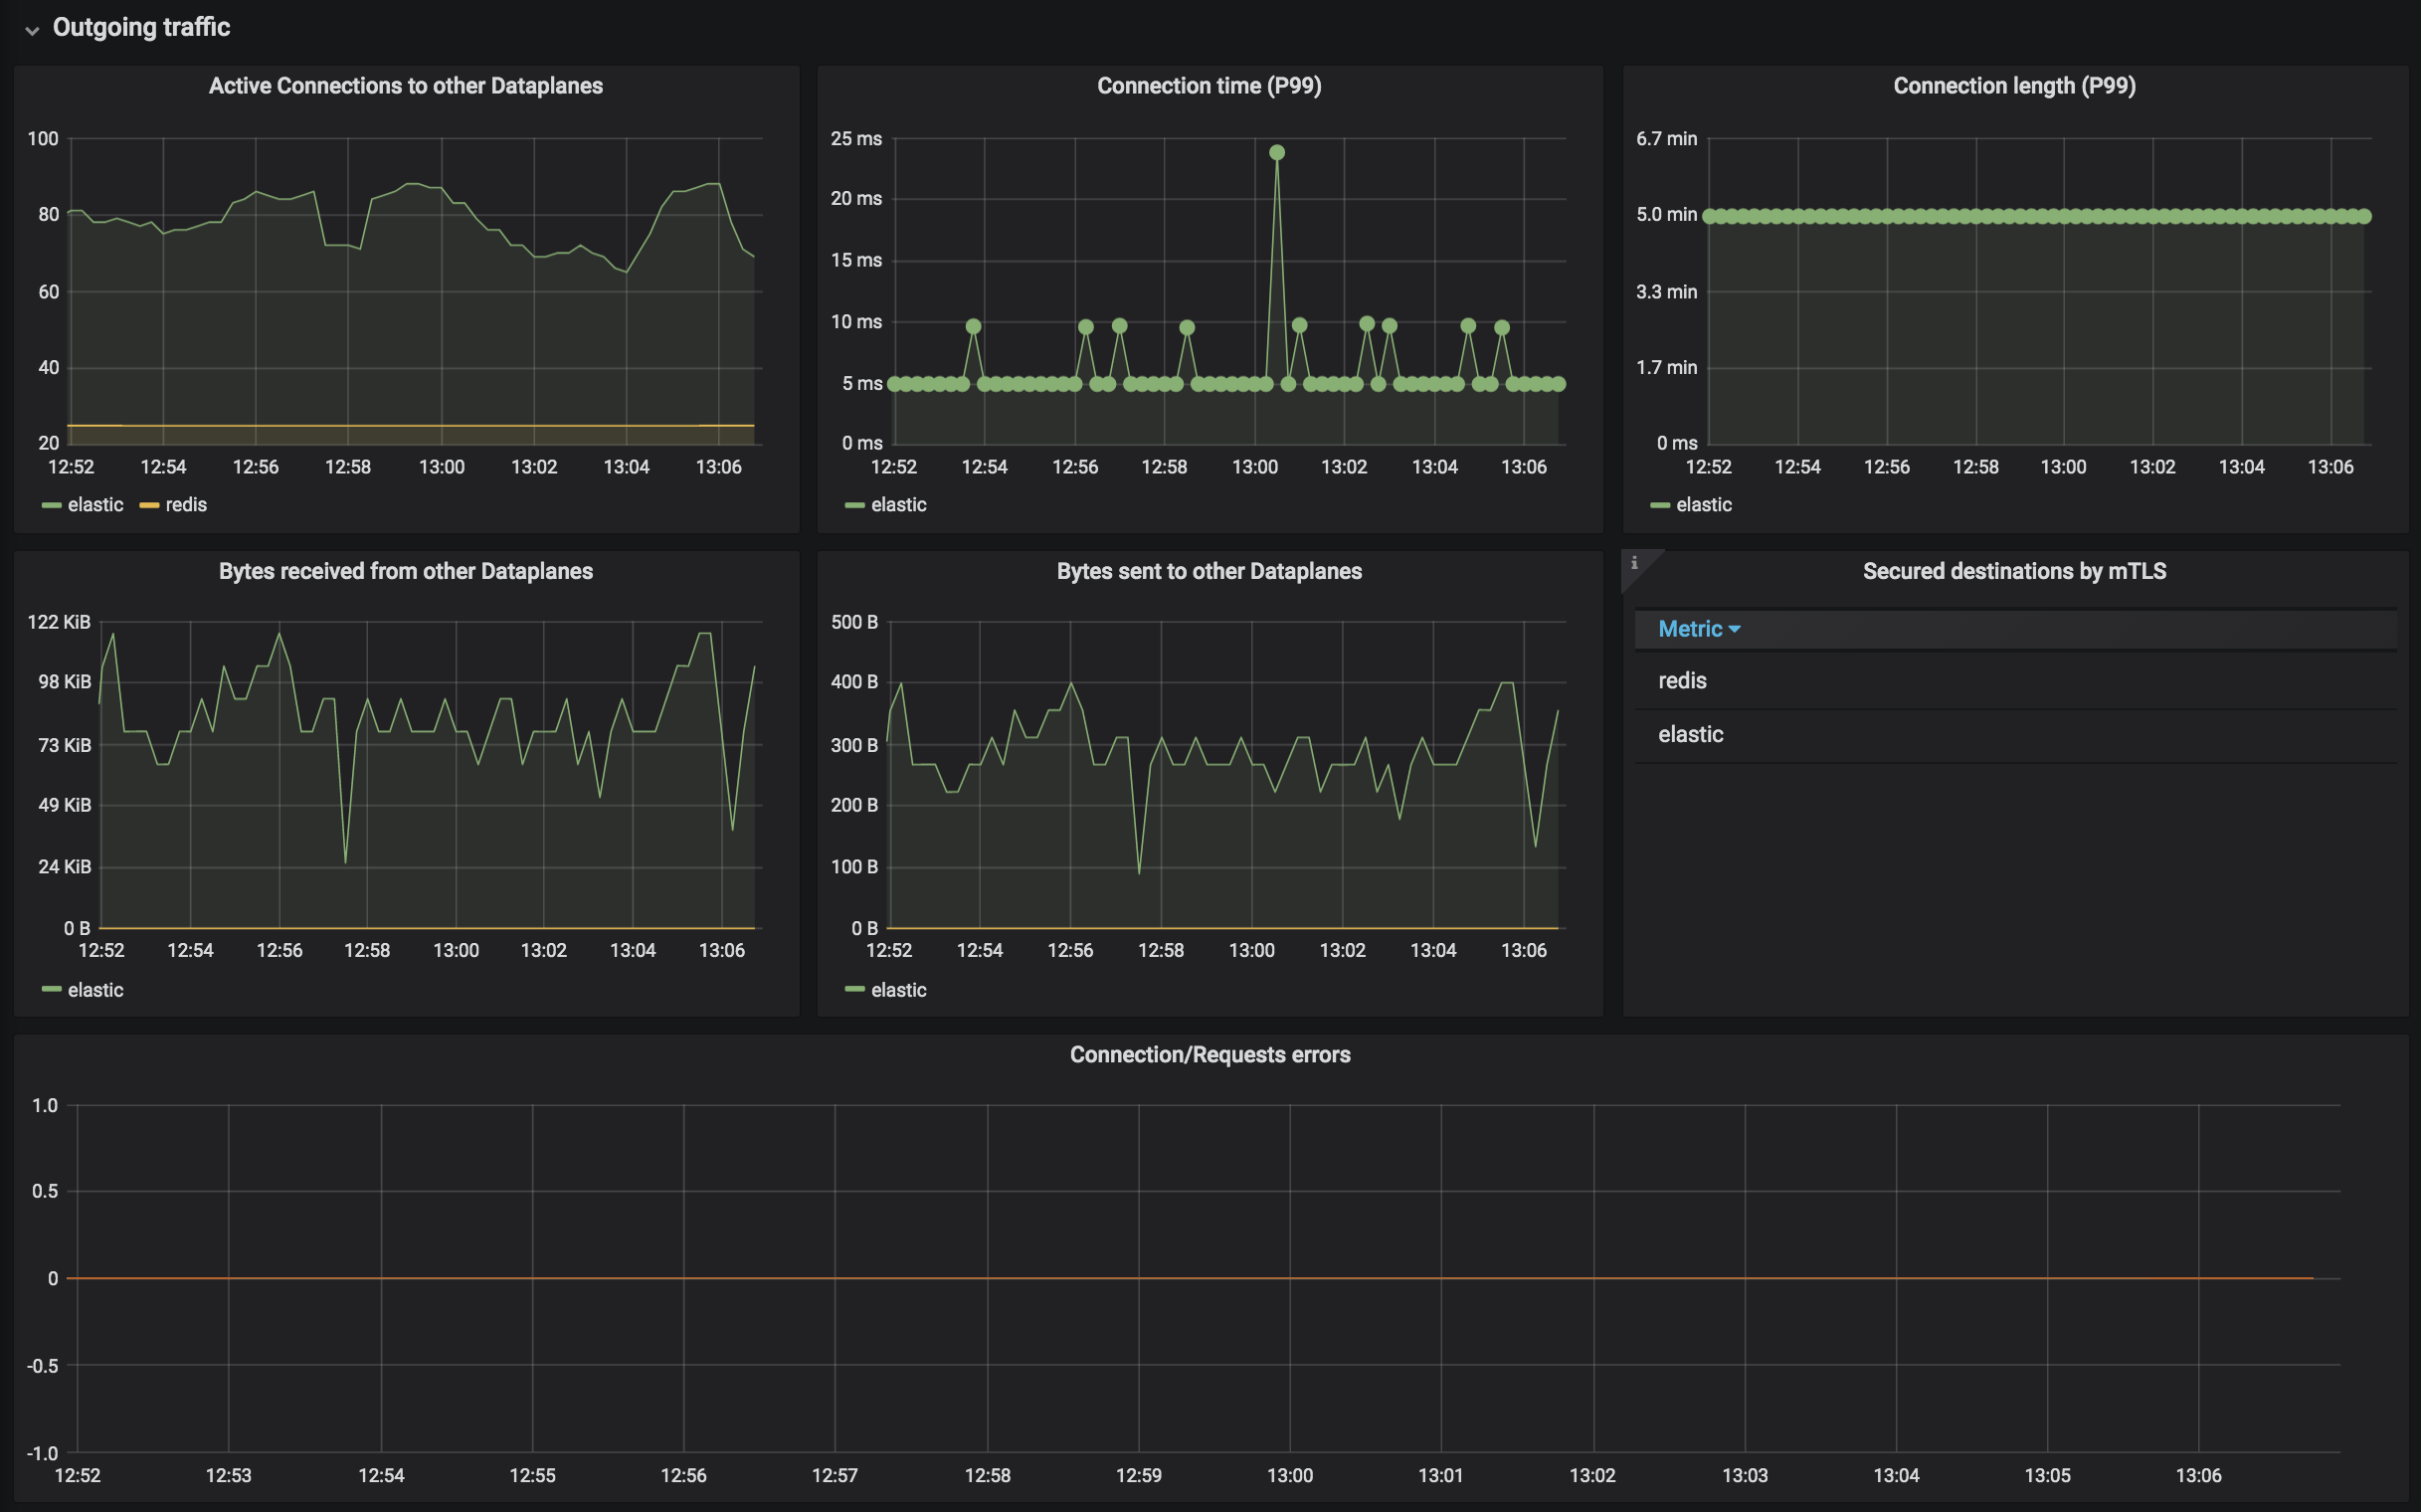
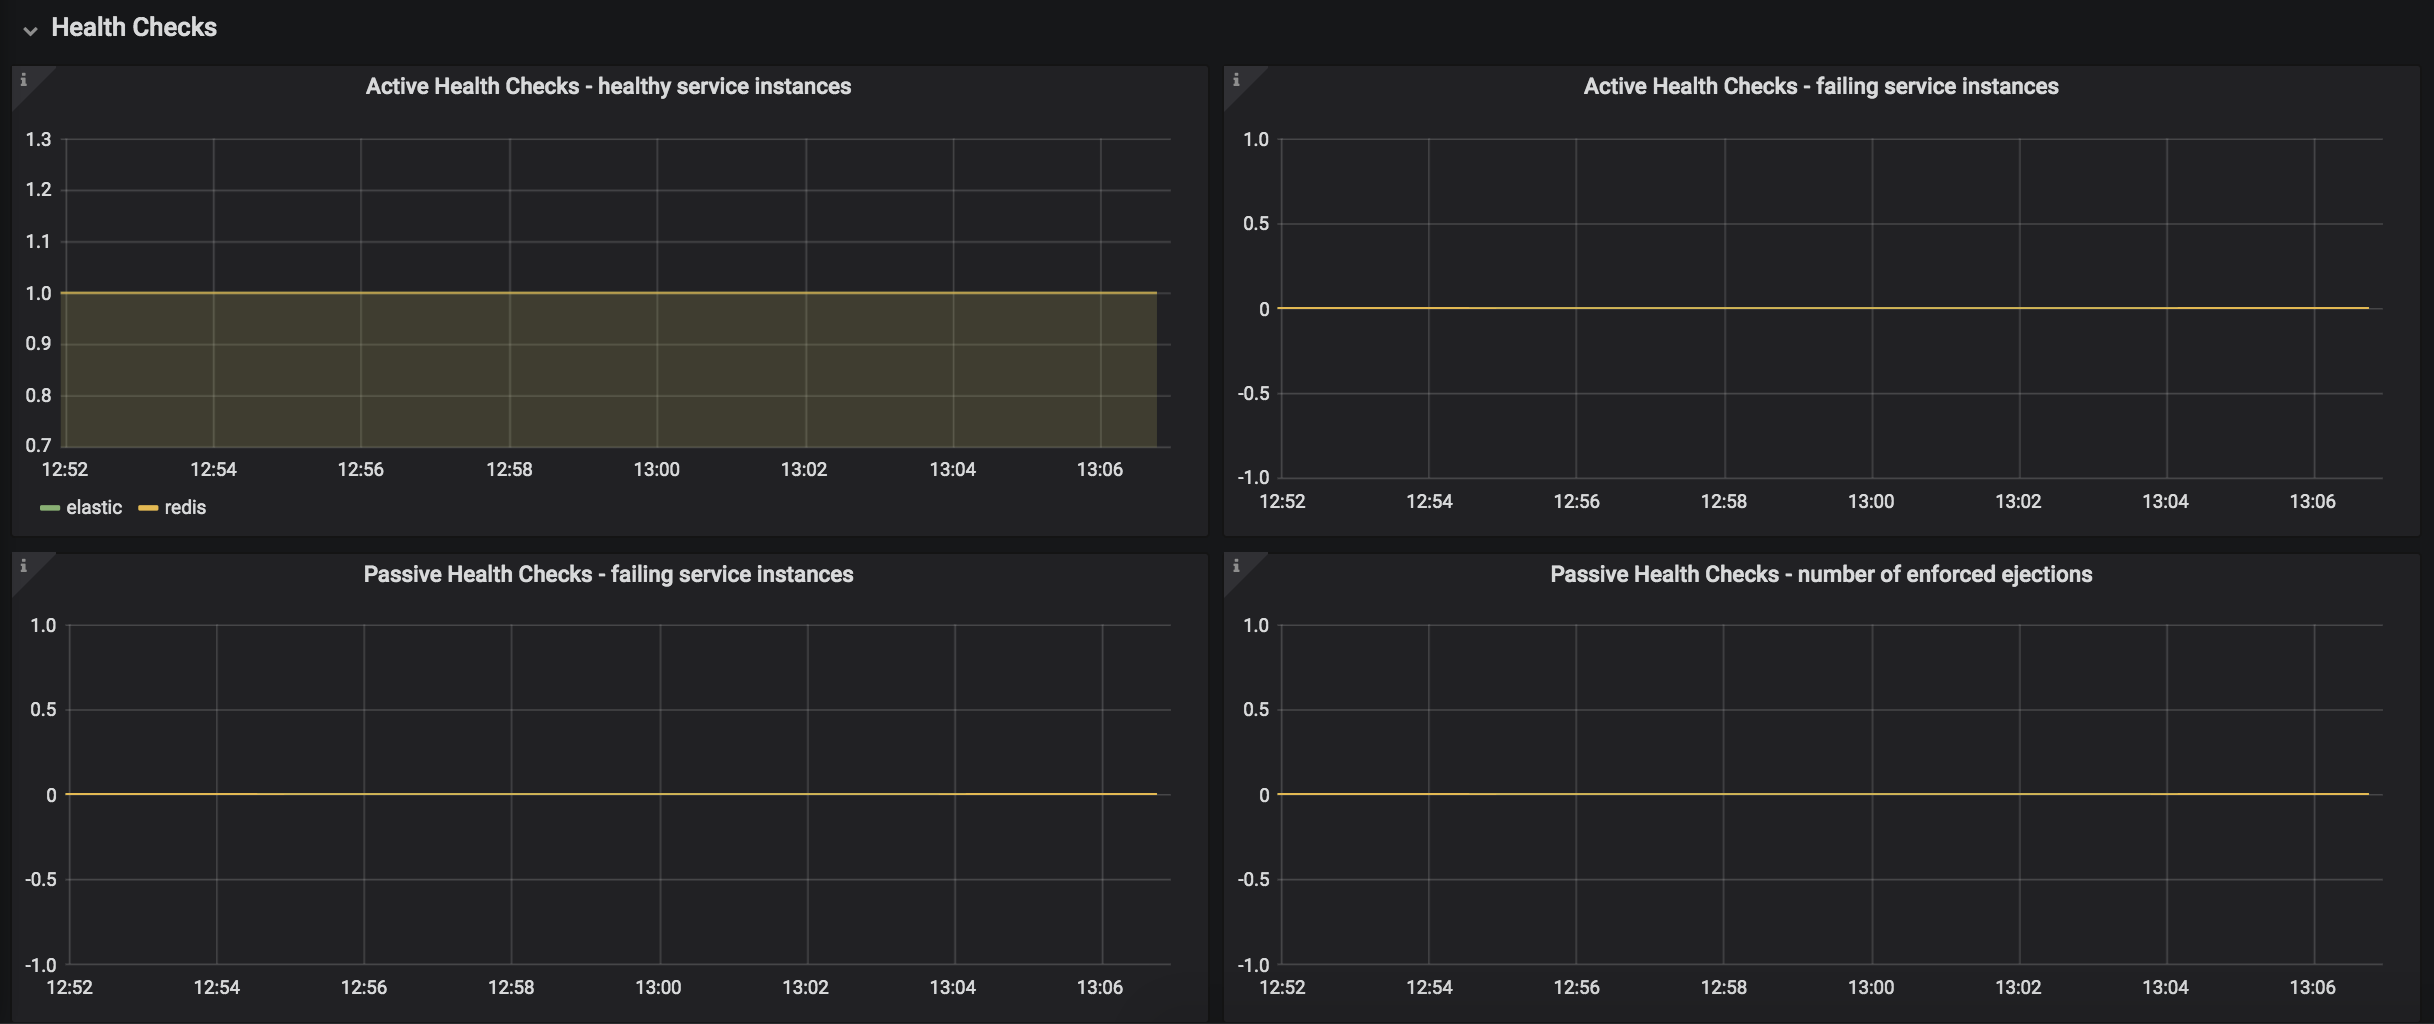
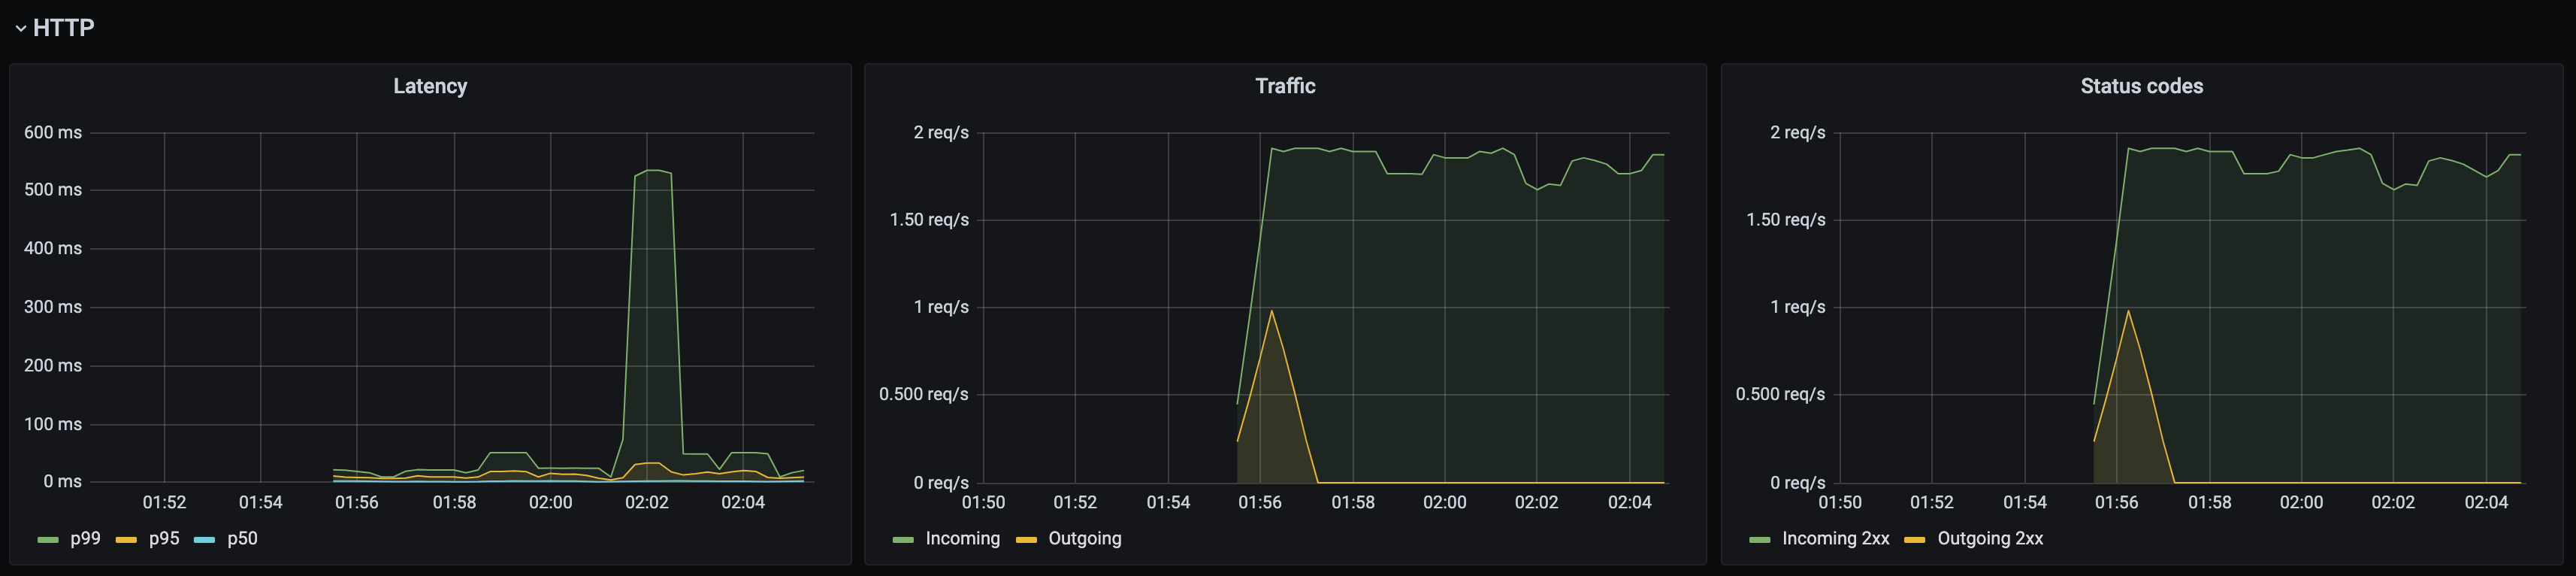
Kong Mesh Dataplane

This dashboard lets you investigate the status of a single dataplane in the mesh. In order to see those metrics, you need to create Traffic Metrics policy first.
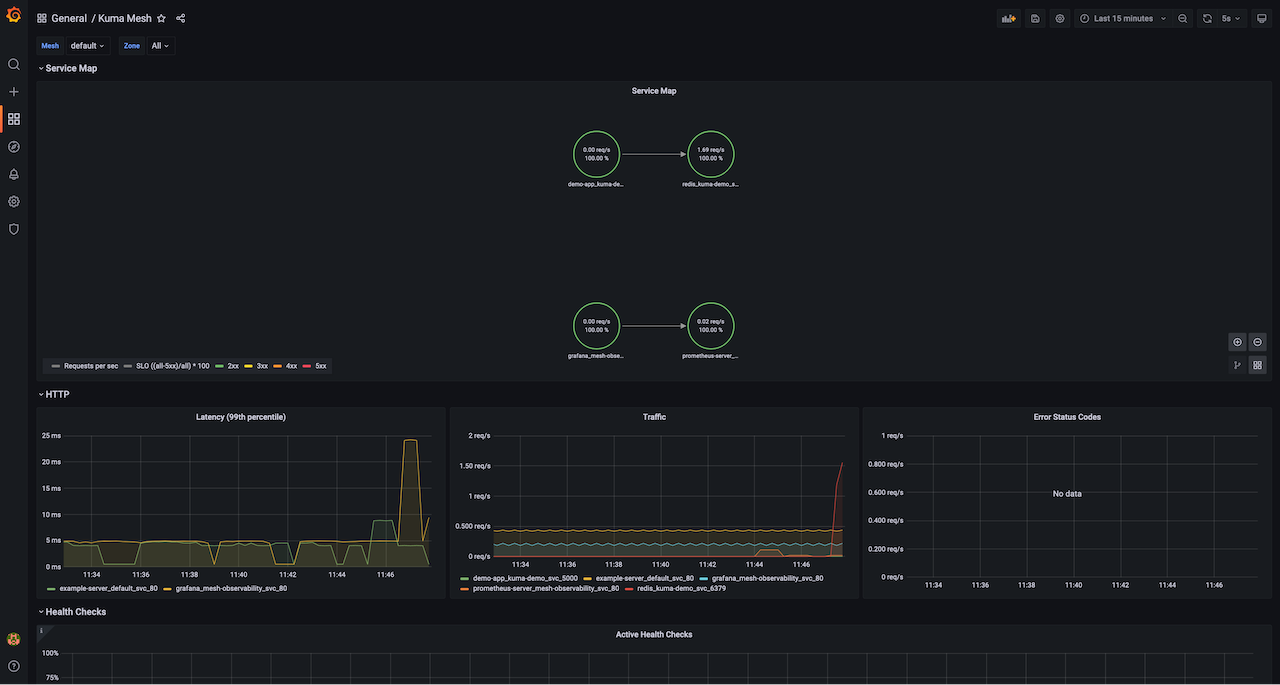
Kuma Dataplane dashboard Kuma Dataplane dashboard Kuma Dataplane dashboard Kuma Dataplane dashboard
Kong Mesh Mesh

This dashboard lets you investigate the aggregated statistics of a single mesh. It provides a topology view of your service traffic dependencies (Service Map) and includes information such as number of requests and error rates.

Kuma Mesh dashboard
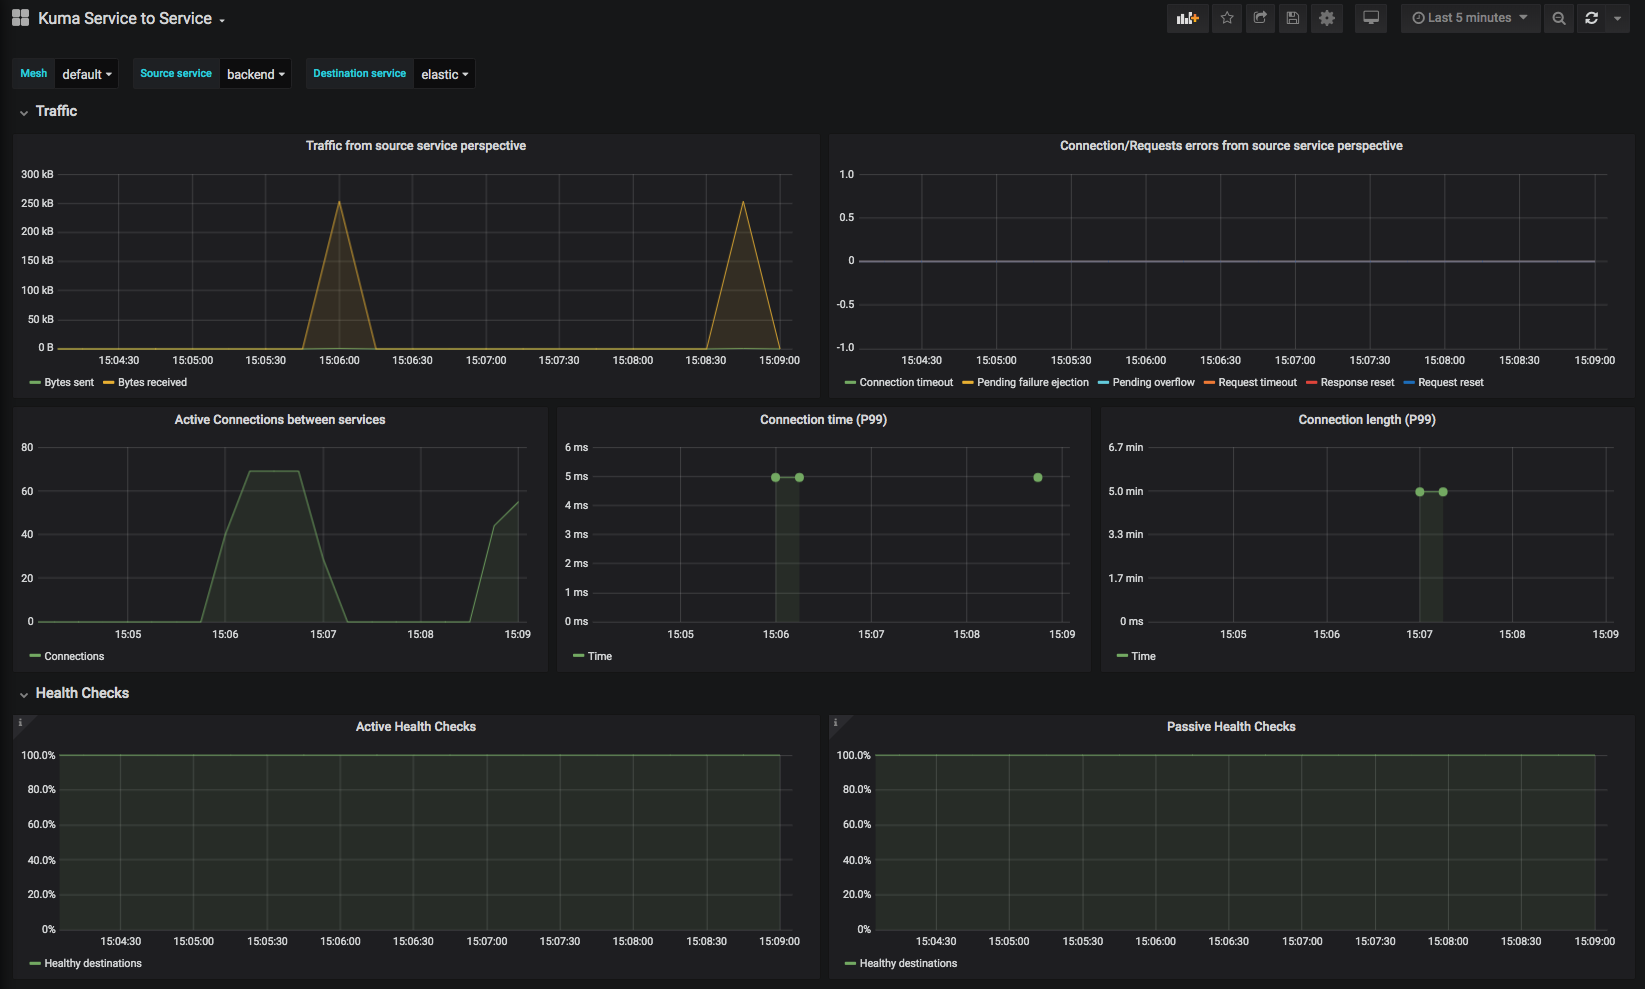
Kong Mesh Service to Service

This dashboard lets you investigate aggregated statistics from dataplanes of specified source services to dataplanes of specified destination service.
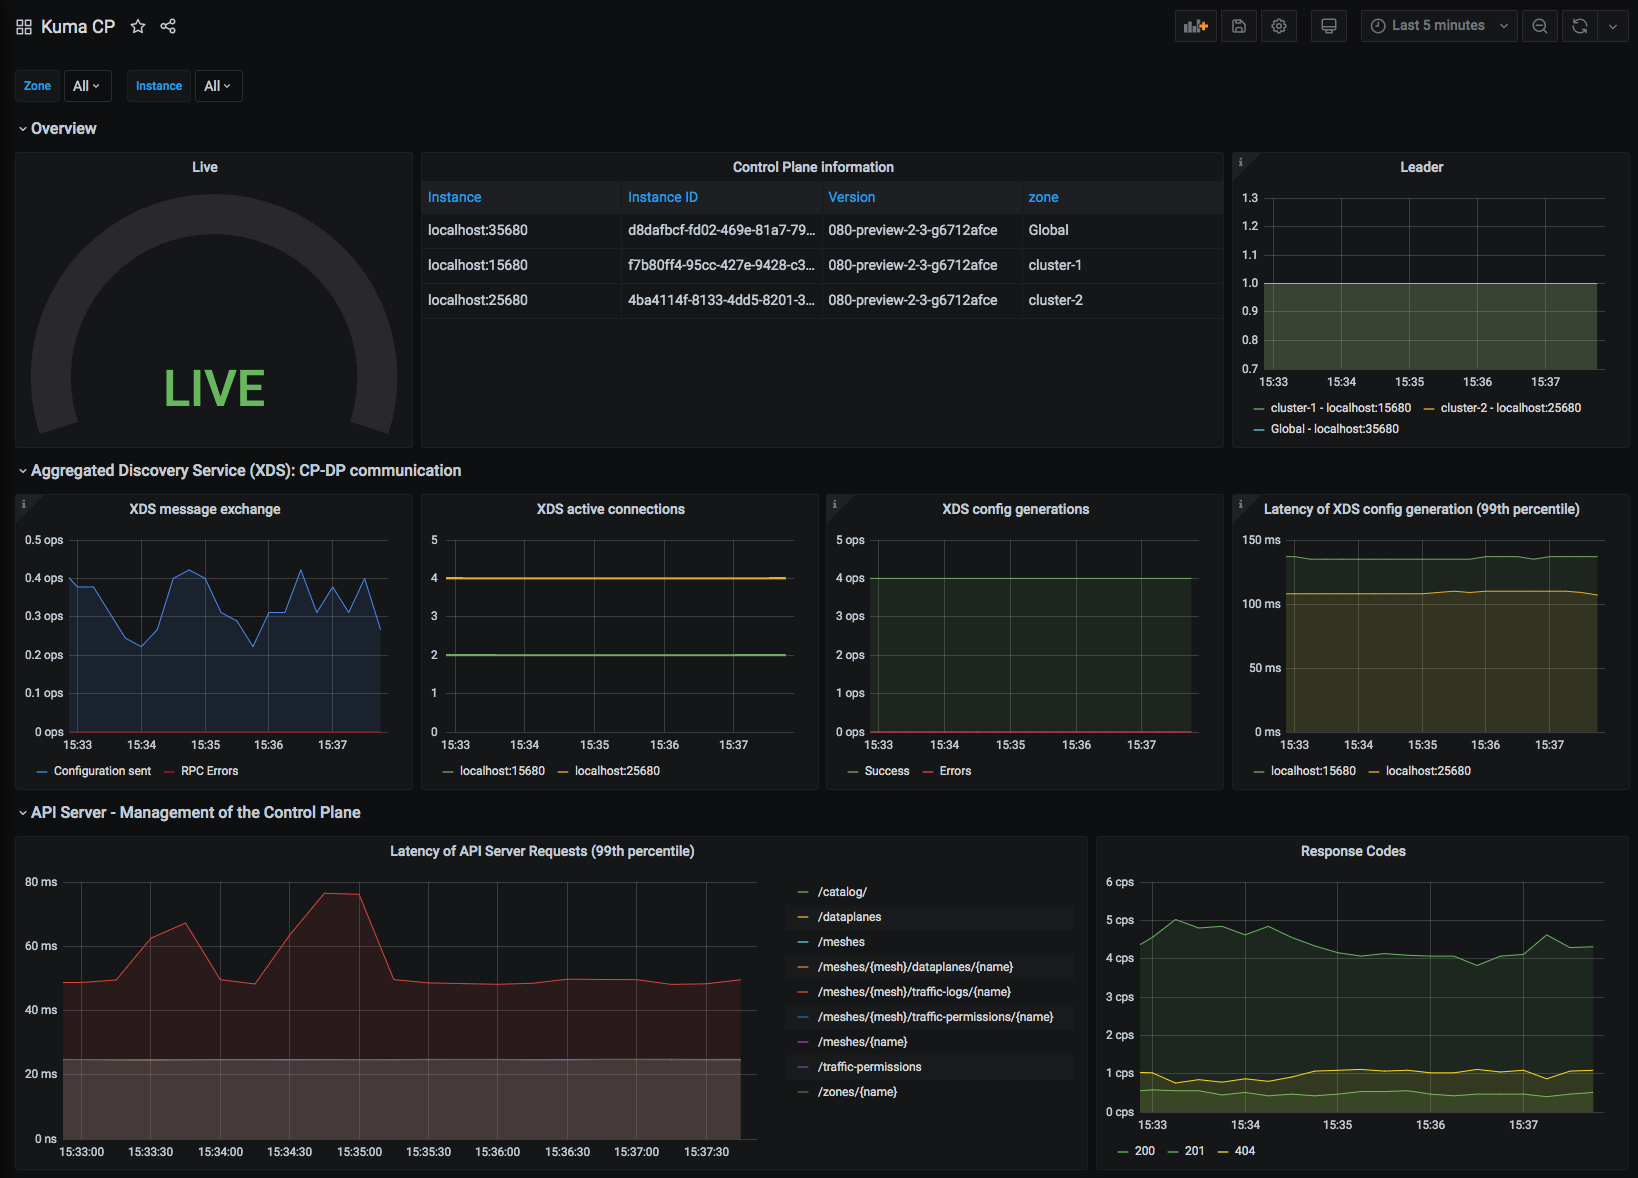
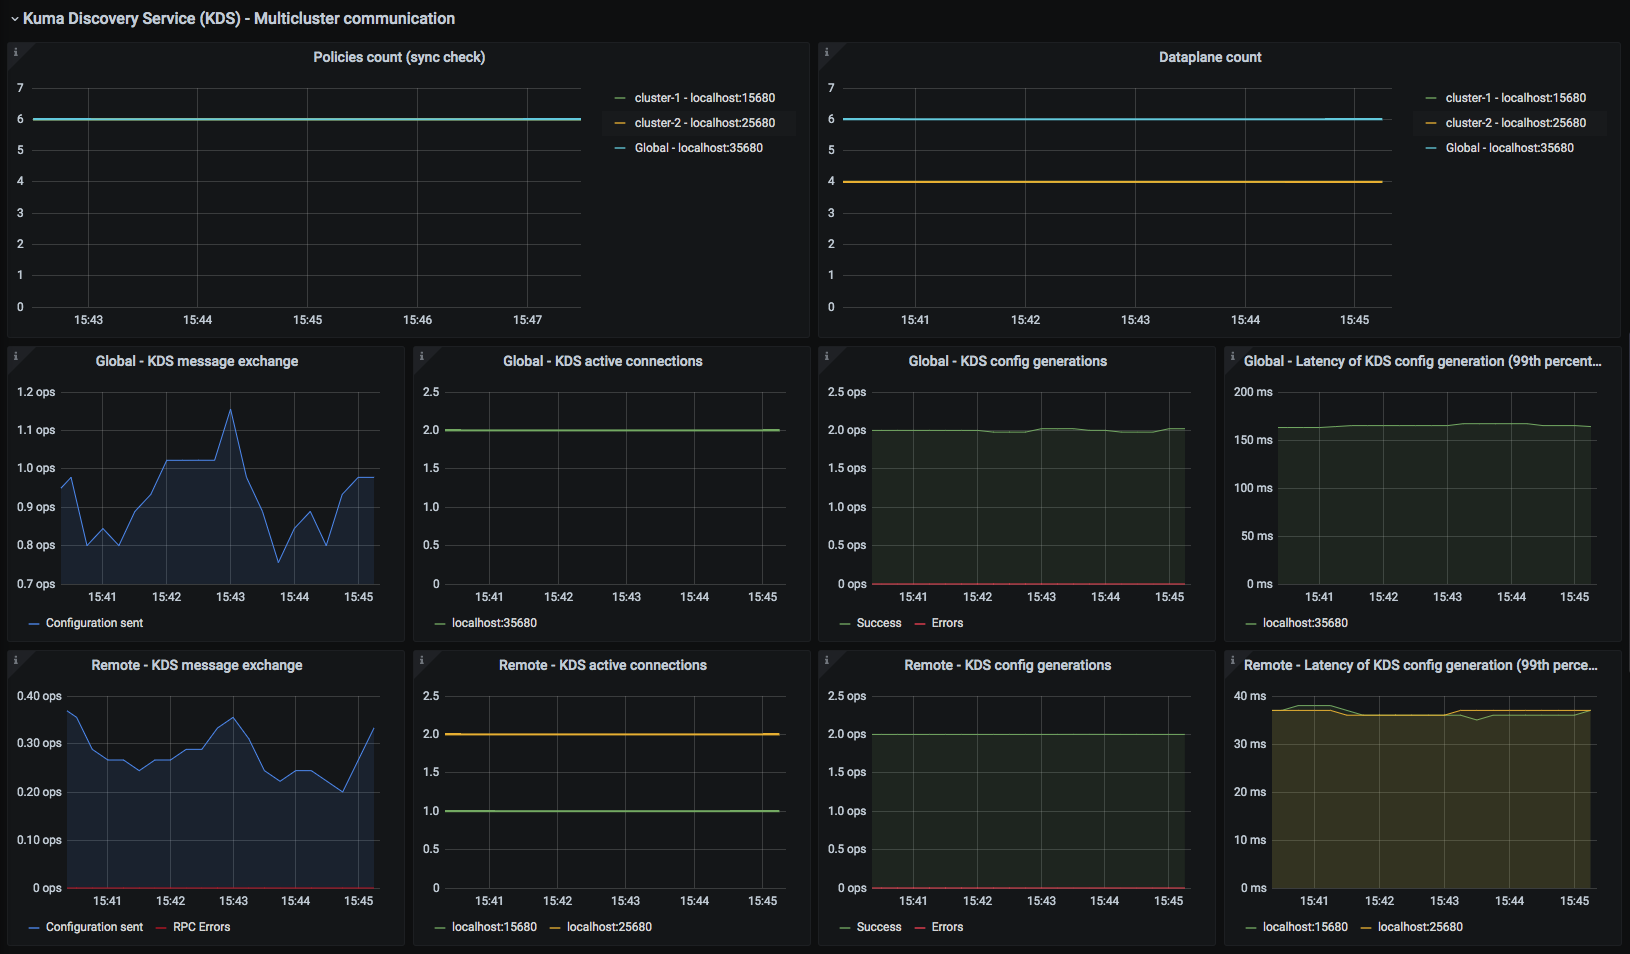
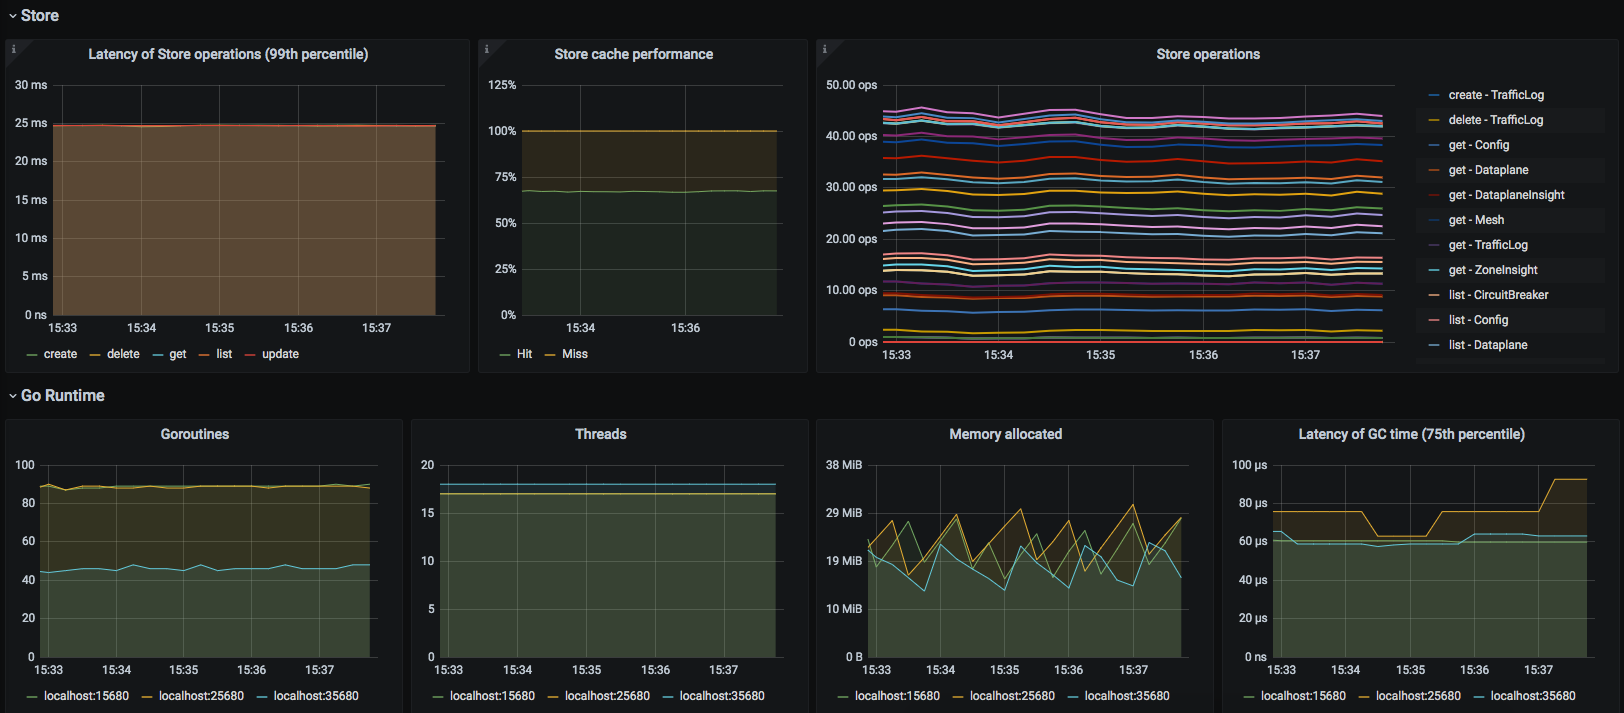
Kuma Service to Service dashboard Kuma Service to Service HTTP
Kong Mesh CP

This dashboard lets you investigate control plane statistics.
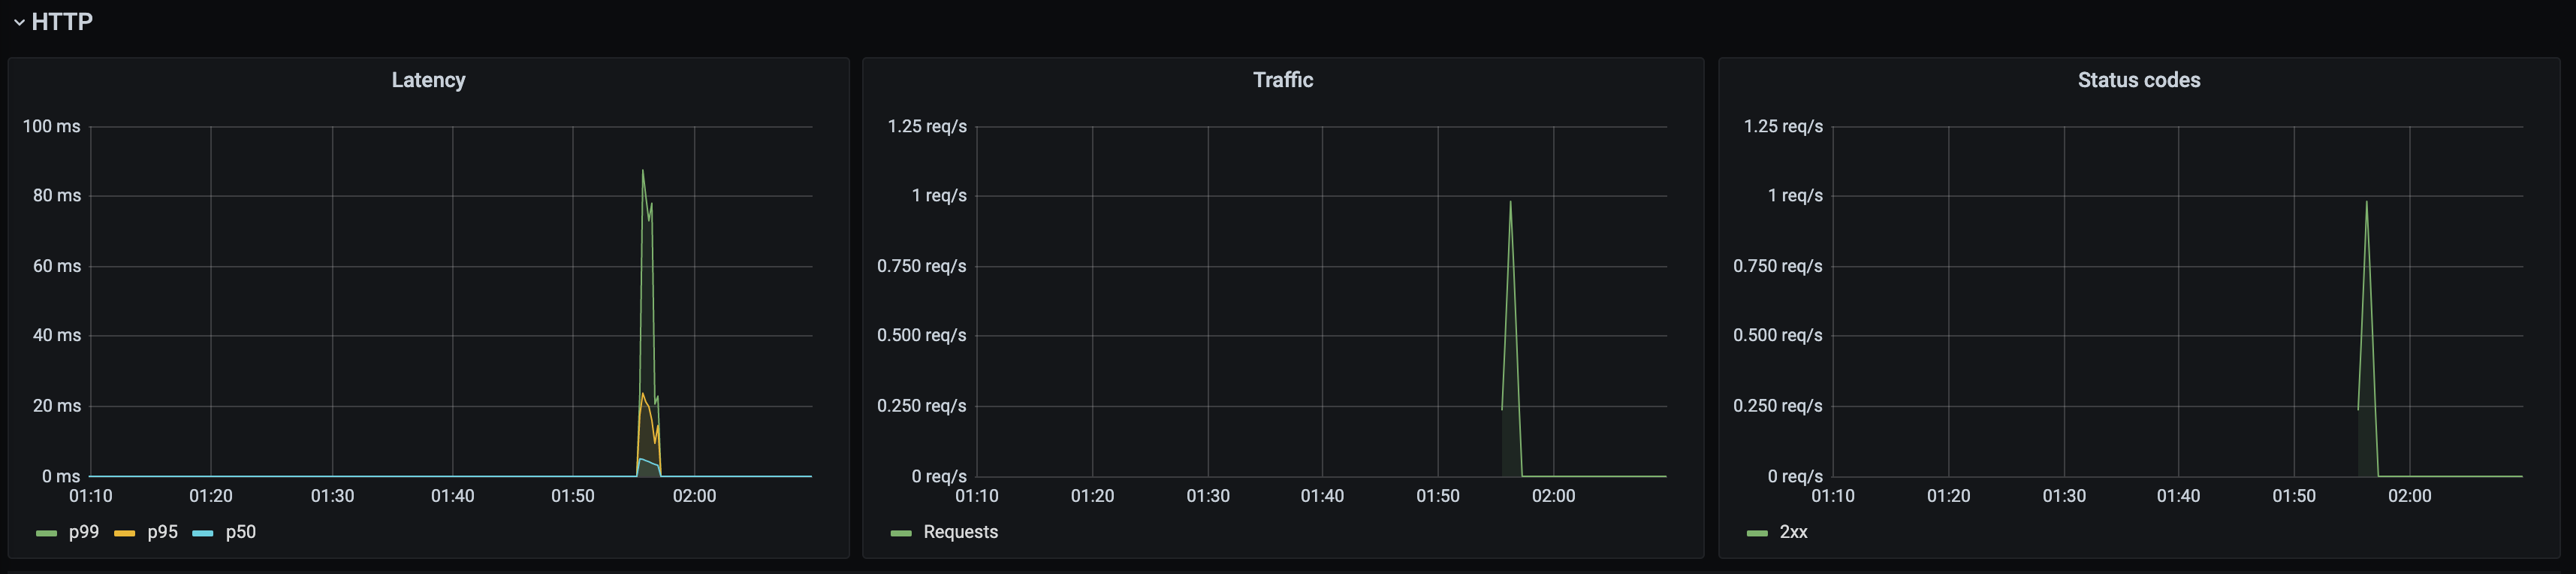
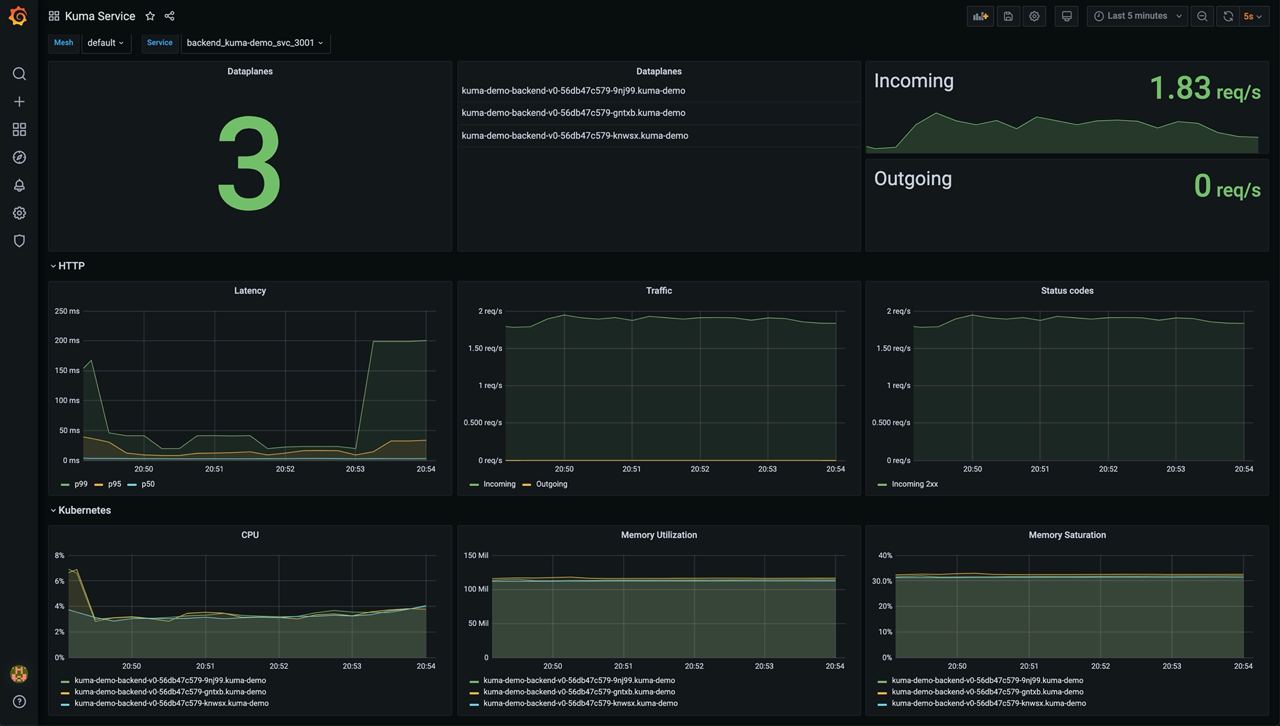
Kuma CP dashboard Kuma CP dashboard Kuma CP dashboard
Kong Mesh Service

This dashboard lets you investigate aggregated statistics for each service.

Kuma Service dashboard
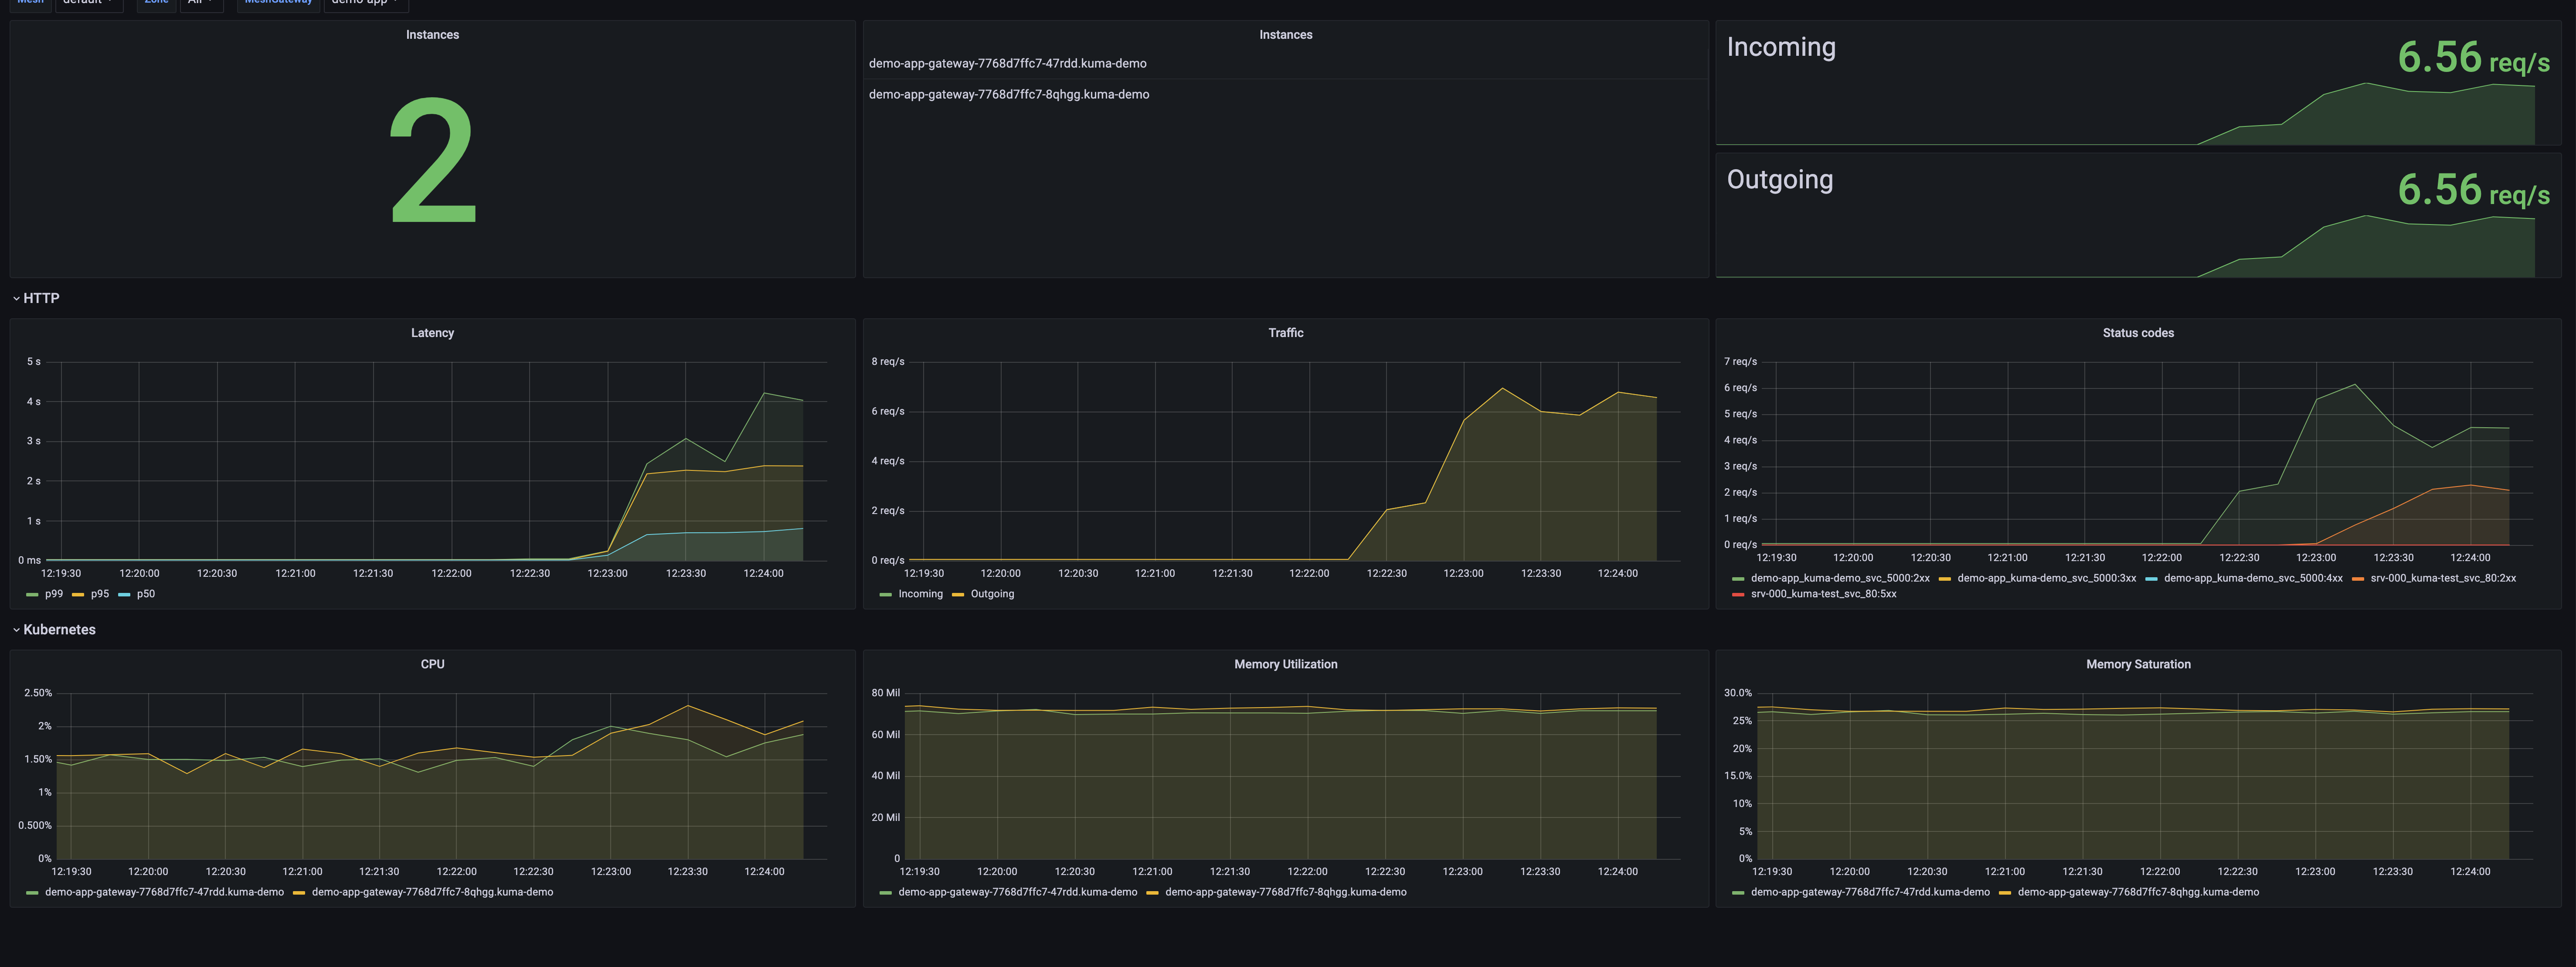
Kong Mesh MeshGateway

This dashboard lets you investigate aggregated statistics for each builtin gateway.

Kuma Gateway dashboard

Configuring Datadog

The recommended way to use Datadog is with its agent.

Kubernetes
Universal

The Datadog agent docs have in-depth installation methods.

Checkout the Datadog agent docs.

Metrics

Kong Mesh exposes metrics with traffic metrics in Prometheus format.

You can add annotations to your pods to enable the Datadog agent to scrape metrics.

Kubernetes
Universal

Please refer to the dedicated documentation.

You need to setup your agent with an openmetrics.d/conf.yaml.

Tracing

Checkout the

  1. Set up the Datadog agent.
  2. Set up APM.
Kubernetes
Universal

Configure the Datadog agent for APM.

If Datadog is not running on each node you can expose the APM agent port to Kong Mesh via Kubernetes service.

apiVersion: v1
kind: Service
metadata:
  name: trace-svc
spec:
  selector:
    app.kubernetes.io/name: datadog-agent-deployment
  ports:
    - protocol: TCP
      port: 8126
      targetPort: 8126

Apply the configuration with kubectl apply -f [..].

Check if the label of the datadog pod installed has not changed (app.kubernetes.io/name: datadog-agent-deployment), if it did adjust accordingly.

Checkout the Datadog agent docs

Once the agent is configured to ingest traces you’ll need to configure a TrafficTrace policy.

Logs

The best way to have Kong Mesh and Datadog work together is with TCP ingest.

Once your agent is configured with TCP ingest you can configure a TrafficLog policy for data plane proxies to send logs.

Observability in multi-zone

Kong Mesh is multi-zone at heart. We explain here how to architect your telemetry stack to accommodate multi-zone.

Prometheus

When Kong Mesh is used in multi-zone the recommended approach is to use 1 Prometheus instance in each zone and to send the metrics of each zone to a global Prometheus instance.

Prometheus offers different ways to do this:

  • Federation The global Prometheus will scrape Prometheus in each zone.
  • Remote Write Prometheus in each zone will directly write metrics to the global, this is meant to be more efficient than the federation.
  • Remote Read like remote write, but the other way around.

Jaeger, Loki, Datadog and others

Most telemetry components don’t have a hierarchical setup like Prometheus. If you want to have a central view of everything you can set up the system in global and have each zone send their data to it. Because zone is present in data plane tags you shouldn’t be worried about metrics, logs, and traces overlapping between zones.

Thank you for your feedback.
Was this page useful?
情報が多すぎる場合 close cta icon
Kong Konnectを使用すると、より多くの機能とより少ないインフラストラクチャを実現できます。月額1Mリクエストが無料。
無料でお試しください
  • Kong
    APIの世界を動かす

    APIマネジメント、サービスメッシュ、イングレスコントローラーの統合プラットフォームにより、開発者の生産性、セキュリティ、パフォーマンスを大幅に向上します。

    • 製品
      • Kong Konnect
      • Kong Gateway Enterprise
      • Kong Gateway
      • Kong Mesh
      • Kong Ingress Controller
      • Kong Insomnia
      • 製品アップデート
      • 始める
    • ドキュメンテーション
      • Kong Konnectドキュメント
      • Kong Gatewayドキュメント
      • Kong Meshドキュメント
      • Kong Insomniaドキュメント
      • Kong Konnect Plugin Hub
    • オープンソース
      • Kong Gateway
      • Kuma
      • Insomnia
      • Kongコミュニティ
    • 会社概要
      • Kongについて
      • お客様
      • キャリア
      • プレス
      • イベント
      • お問い合わせ
  • 利用規約• プライバシー• 信頼とコンプライアンス
© Kong Inc. 2025